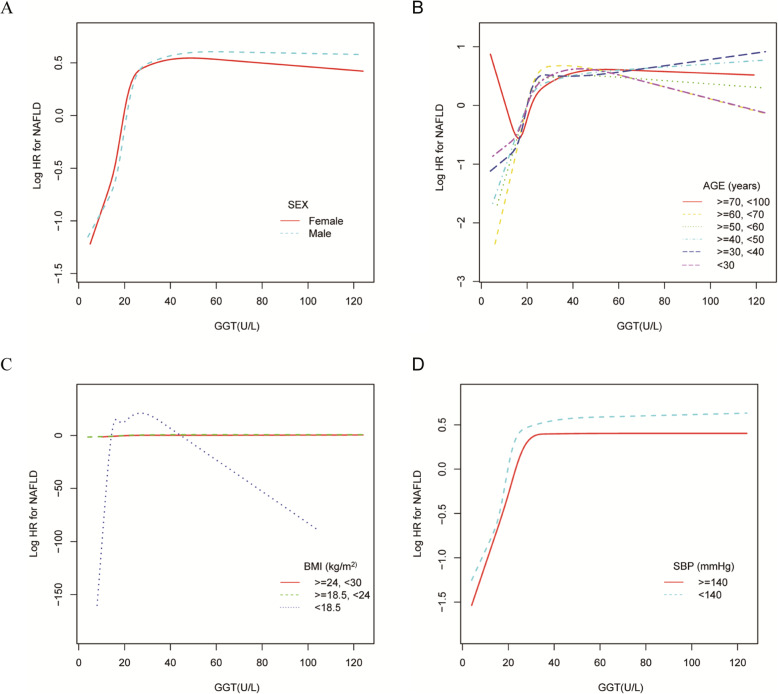
Fig. 4.
Association of GGT with the risk of NAFLD in subgroups analysis The non-linear relationship between GGT and incident of NAFLD according to subgroups in the adjusted analysis. Note 1: Above model adjusted for age, gender, BMI, SBP, DBP,, TC, TG, HDL-C, LDL-C, ALT, AST, ALP, ALB, GLB, TB, DBIL, BUN

