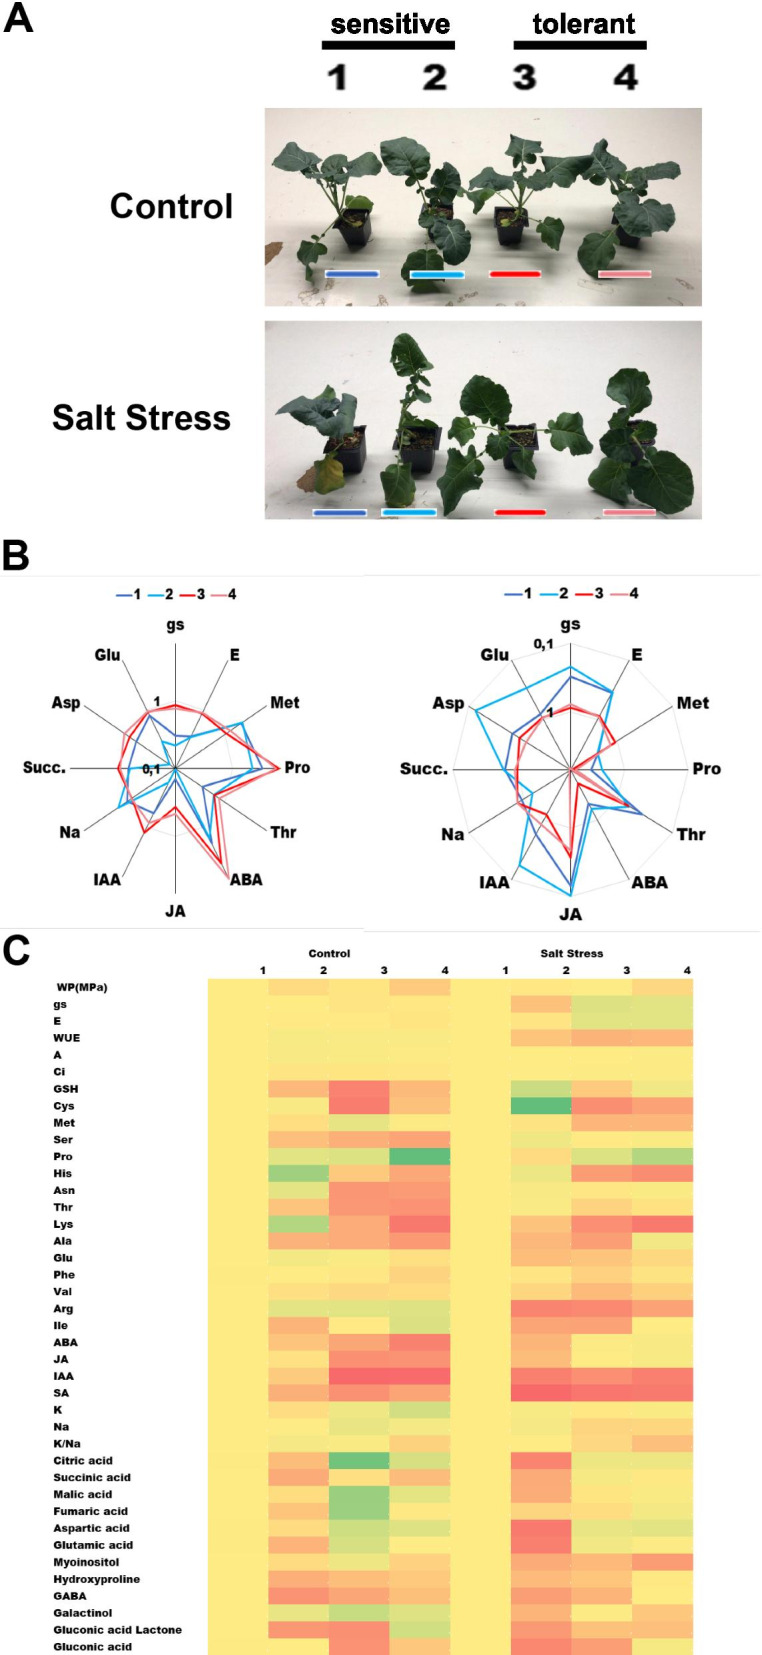
Fig. 9.

Summary of the main findings of this study. Representative plants of each cultivar under normal watering (upper panel) or after 6 days of salt stress (lower panel) (A). Radial diagrams of the ratio between stress/control concentration (left) or control/stress concentration (right). The tolerant lines are shown in shades of blue and the sensitive lines in shades of red. The values are represented in a decimal logarithmic scale (B). Heat map of all the results obtained in the present study. Green indicates higher normalized values, yellow average values while red indicates lower values (C)
