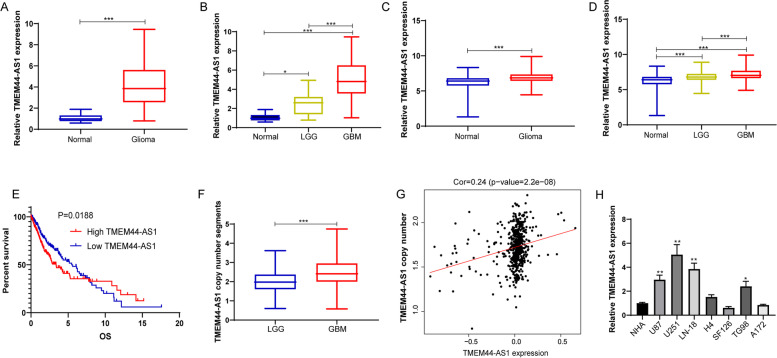
Fig. 1.
Expression of TMEM44-AS1 in various tissues and cells. (A) Relative TMEM44-AS1 expression in glioma and normal brain tissues from our cohort. (***P < 0.001). (B) The TMEM44-AS1 expression is shown according to the histopathologic grades. (*P < 0.05, ***P < 0.001). (C) Relative TMEM44-AS1 expression in glioma and normal brain tissues from GTEX(n = 1136) and the TCGA database(n = 689). (***P < 0.001). (D) The TMEM44-AS1 expression is shown according to the histopathologic grades of TCGA gliomas. LGG (n = 523); GBM (n = 166). (***P < 0.001). (E) Kaplan-Meier curves of overall survival time of patients based on TMEM44-AS1 expression in glioma samples obtained from the TCGA database. (F) TMEM44-AS1 copy number segments in LGG and GBM were tested using the TCGA database. (***P < 0.001). (G) The correlation between TMEM44-AS1 copy number and TMEM44-AS1 expression in glioma from the TCGA database (n = 528). (H) Relative TMEM44-AS1 in NHA, U87, U251, LN-18, H4, SF126, T98G, A172 cell lines (*P < 0.05, **P < 0.01)

