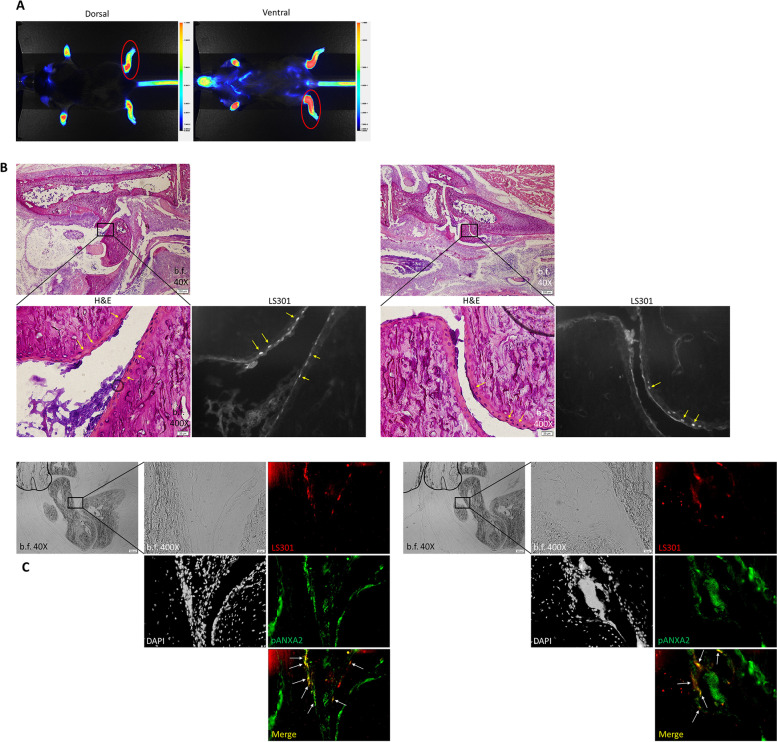
Fig. 6.
Cellular localization of LS301 in the arthritic mouse paws. C57BL/6 mice with serum transfer arthritis were intravenously injected with 6 nmol LS301 at day 4 post disease induction. 6 h after LS301 injection, whole body near-infrared fluorescence images were takePlease check if the figure captions are presented correctly.n on the Pearl animal imaging system with λ = 820 nm, and subsequently paws and ankles were harvested and frozen for sectioning. Sections were stained with H&E, or left unstained and examined for LS301 fluorescence by microscopy under the cypate channel (Ex/Em 775±25nm/845±28nm) (red) and/or viewed for pANXA2 (AlexaFluor 594 fluorescence) (green) under the Texas Red channel (Ex/Em 562±20nm/624±20nm). Images are representative of results from at least two independent experiments. A Example Pearl near-infrared fluorescence images of mice immediately prior to limb harvest. Red circles denote representative examples of the limb area harvested for sectioning. B H&E and fluorescence images from corresponding regions of articular cartilage in mouse ankle. Arrows indicate example regions of LS301 accumulation. C Fluorescence microscopy images from corresponding regions of articular cartilage in mouse ankle. Sections were stained with DAPI and anti-pANXA2 Ab/AlexaFluor 594-conjugated secondary Ab. Shown are DAPI (grayscale), LS301 fluorescence (red), and pANXA2 (green). Arrows denote LS301-pANXA2 colocalization

