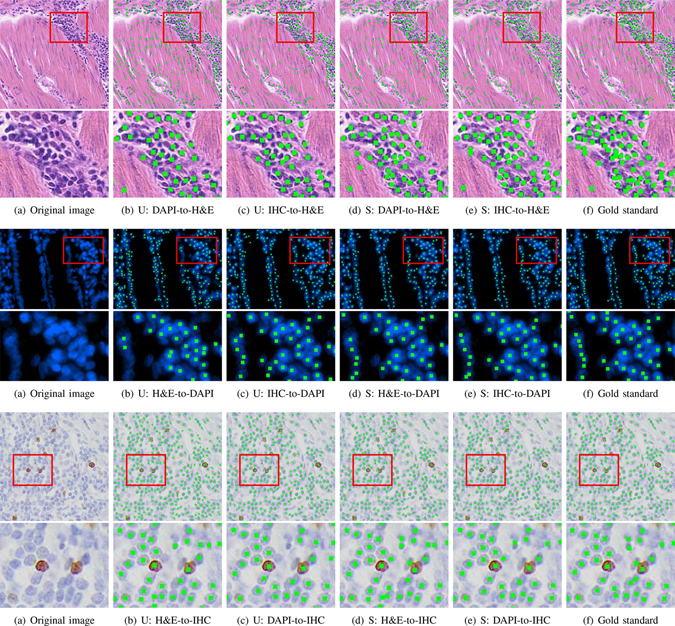
Fig. 3.
Nucleus detection of the proposed methods, and , on the H&E (rows 1 ~ 2), DAPI (rows 3 ~ 4) and IHC (rows 5 ~ 6) datasets. The red-rectangle regions in rows 1, 3, and 5 are zoomed in rows 2, 4 and 6, respectively. Columns (a) and (f) denote original images and gold standard annotations (green dots), respectively. Columns (b) and (c) represent the detection results of in different experimental settings (source-to-target), and columns (d) and (e) are the results of with 5% target training annotations.

