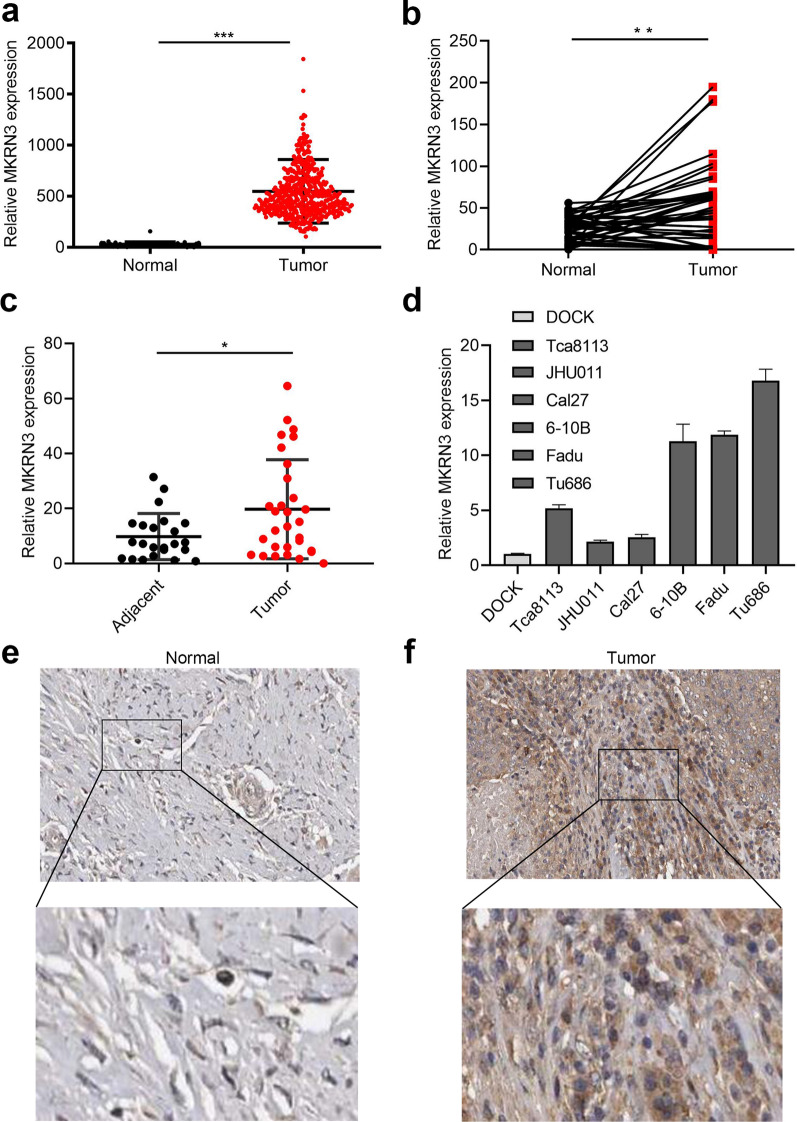
Fig. 2.
Elevated expression of MKRN3 in SCCHN. a, b Differential expression of MKRN3 in SCCHN tissue samples according to TCGA data (a) and paired difference analyses (b). c MKRN3 mRNA expression levels in patients with normal tumor tissues. d Relative expression level of MKRN3 mRNA in six different SCCHN cell lines and an immortalized non-malignant cell line derived from oral mucosa (DOK). The gene expression was normalized to GAPDH. e, f Representative immunohistochemical staining shows the expression of the MKRN3 protein in normal (e) and SCCHN tissues (f) according to TCGA (200× , 400×). Data are presented as the mean ± standard deviation. P-values were calculated using the Student’s t-test. *P < 0.05; **P < 0.01; ***P < 0.001. TCGA, The Cancer Genome Atlas

