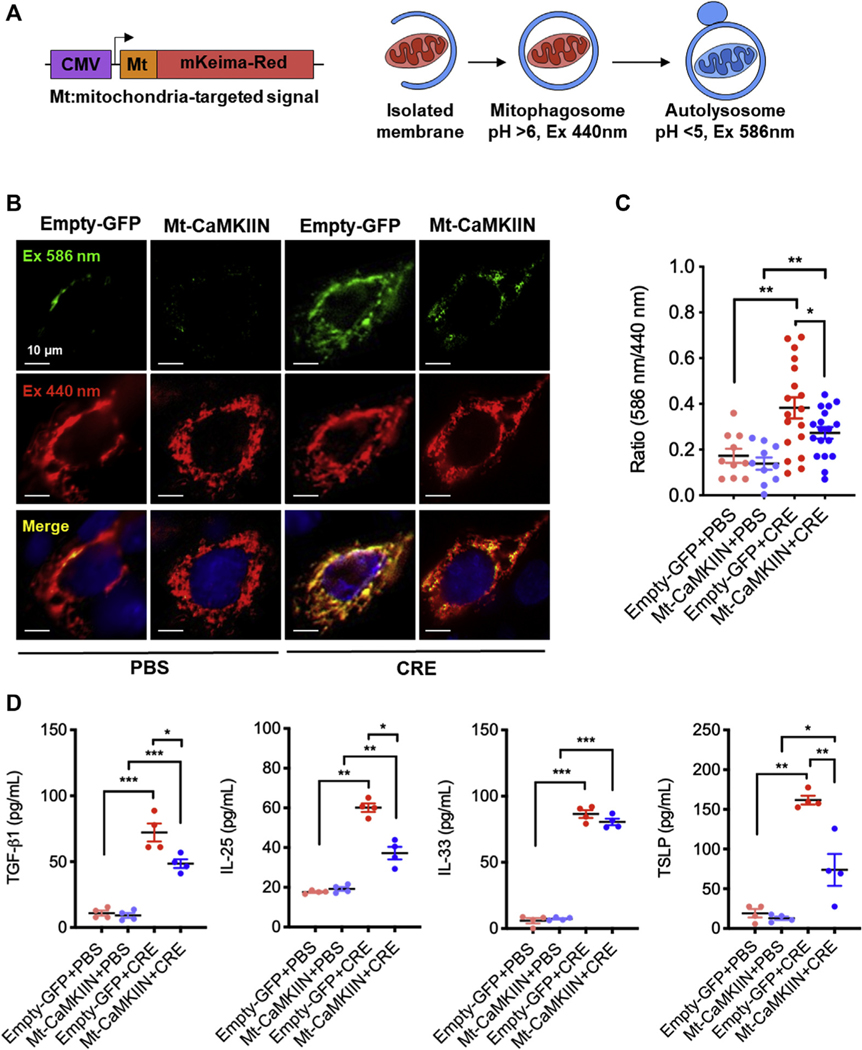
FIG 7.
Inhibition of mitochondrial CaMKII suppressed cockroach allergen–induced mitophagy in airway epithelial cells. A, Scheme of mitophagy detection with MT-mKeima-Red. B, Representative immunofluorescence images of mitophagy with MT-mKeima-Red (red) and mitochondria (Mitotracker, green) in empty-GFP or Mt-CaMKIIN–transfected HBECs with PBS or CRE treatment. C, Quantitative analysis of florescent signals in HBECs (n = 10–18). D, Quantitative analysis of TGF-β1, IL-25, IL-33, and TSLP levels in supernatants in Mock or CaMKIIN-transfected HBECs with PBS or CRE treatment for 4 hours (n = 4). Data represent mean ± SEM. *P < .05, **P < .01, ***P < .001.

