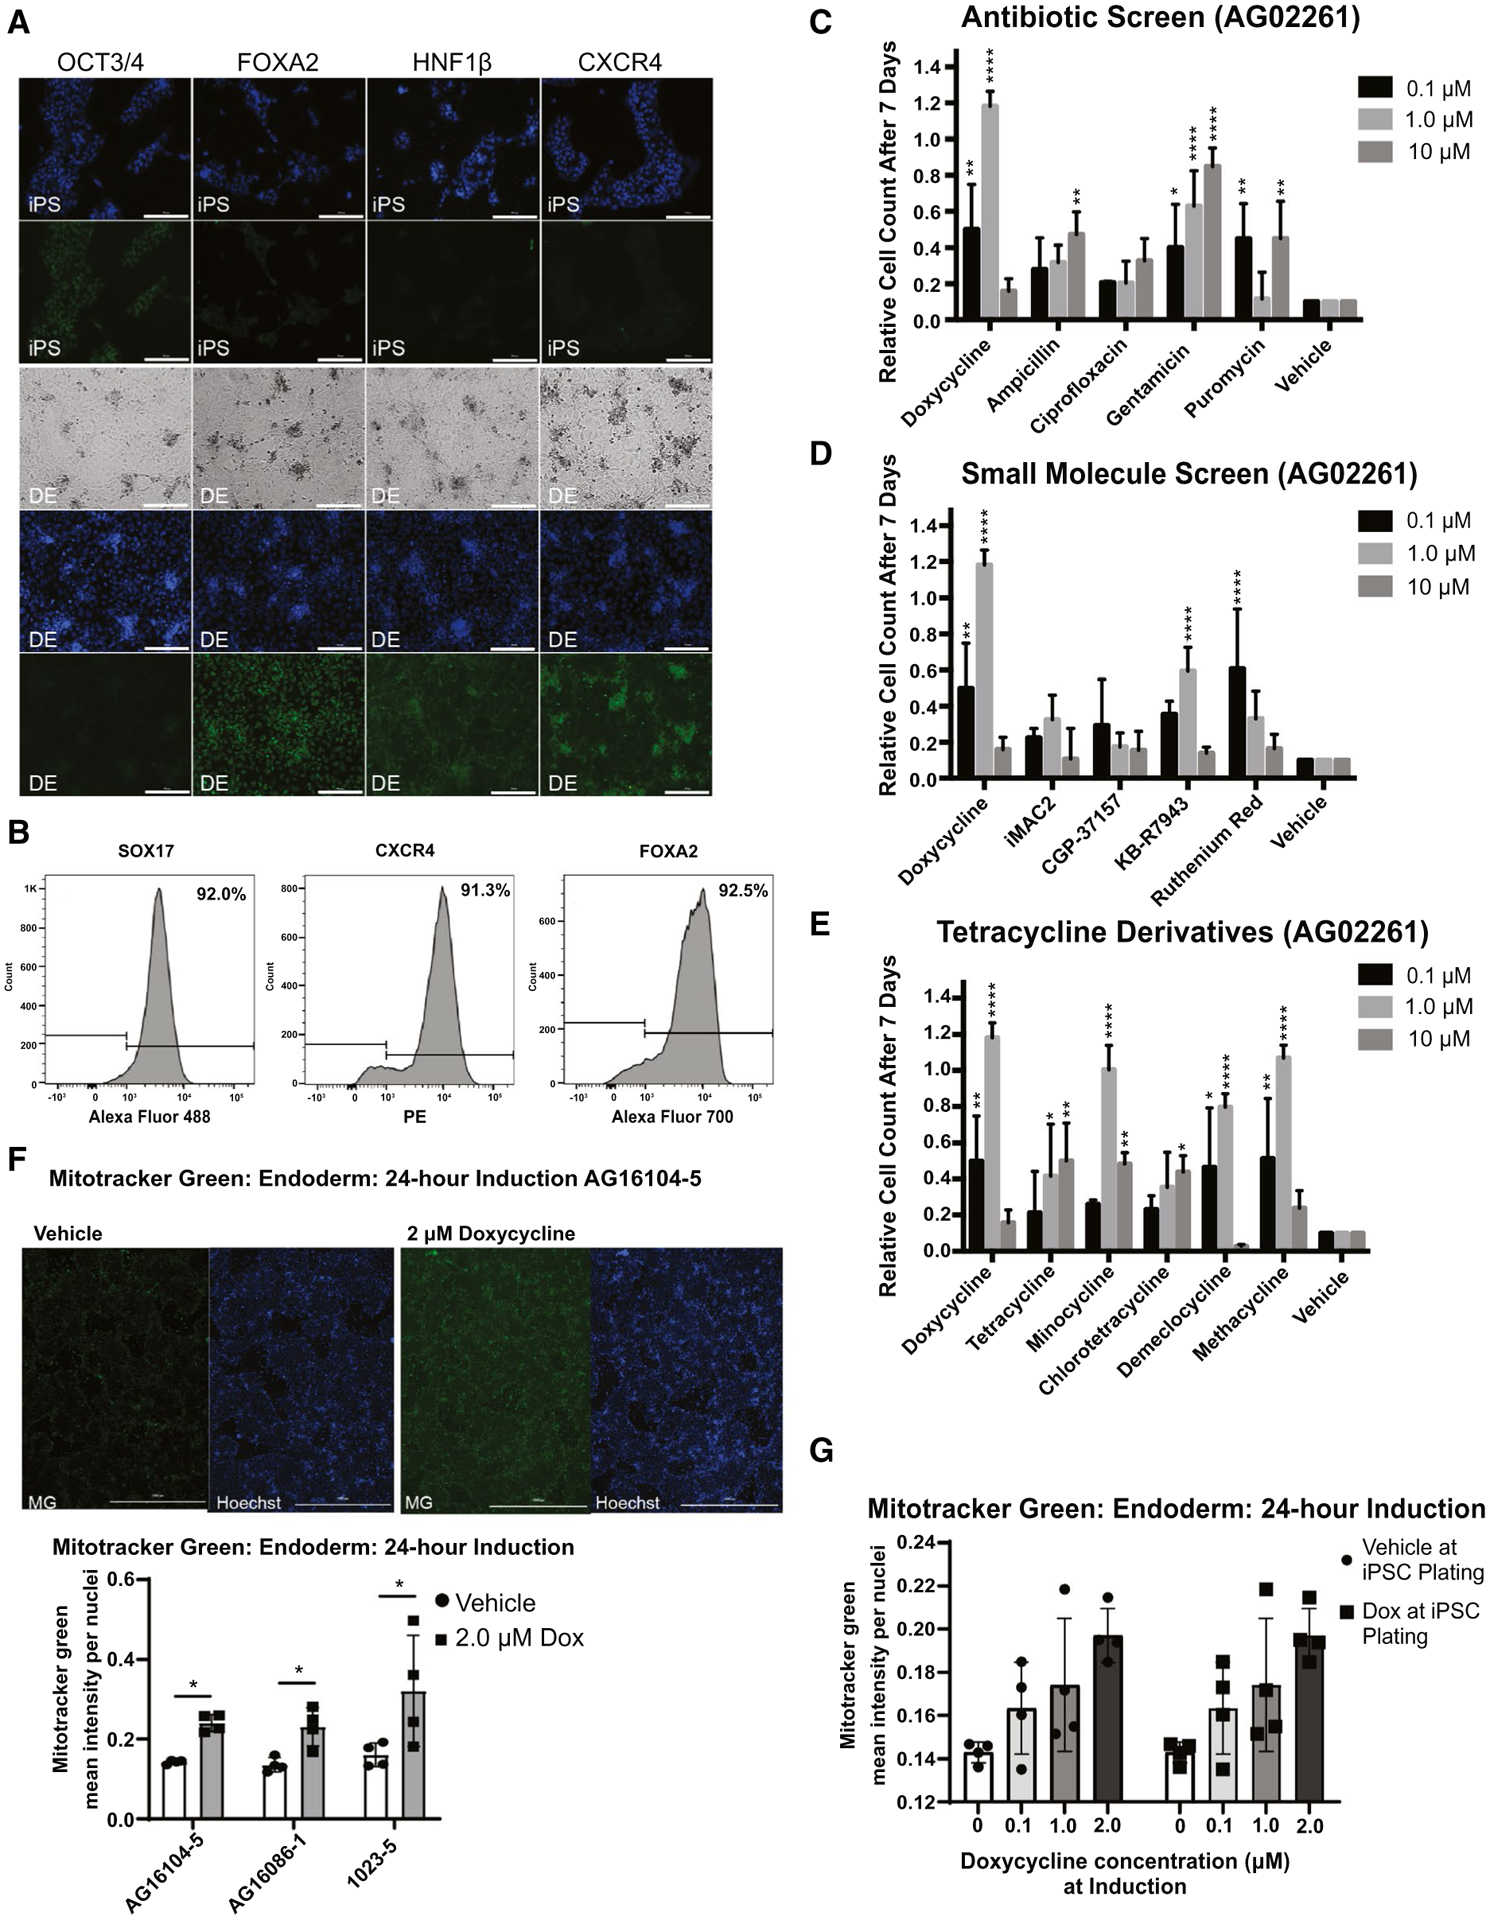
FIG. 2.

Dox-enhanced endoderm and testing of additional compounds. (A) Immunofluorescence and bright-field images showing induction of iPSC line 1023-5 to definitive endoderm (DE) with Hoechst 33342 nuclear staining in blue and antibody staining for OCT3/4 (POU Class 5 homeobox 1), FOXA2, HNF1β (HNF1 homeobox B), and CXCR4 with Alexa Fluor 488 secondary (green) antibody. Bright-field microscopy shows complete monolayer (scale bar = 200 μM). (B) FACS analysis was used to determine the percentage of SOX17, CXCR4, and FOXA2 expression during in iPSC-derived endoderm (n = 3 technical replicates for two independent cell lines: iPSC 1023-5 and AG12107c, data shown are for cell line iPSC 1023-5, representative experiment; AG12107c data are shown in SupportingFig. S2C). (C) Compound screen for iPSC induction to endoderm using other antibiotics affecting the mitochondria compared to Dox as additives to the protocol. Compounds were added instead of Dox to protocol ML1. Whereas most antibiotics failed to have the same magnitude of an effect, surprisingly gentamycin had a decent dose response. The number of cells is shown measured 7 days after induction compared to the plating density at day 0 (n = 3 technical replicates for each independent cell line). (D) Compound screen for iPSC induction to endoderm using small molecules affecting the mitochondria compared to Dox as additives to the protocol. Compounds were added instead of Dox to protocol ML1. KB-R7943 and ruthenium red showed responses at specific doses in one cell line shown here (AG02261), but not another cell line (AS7192) in Supporting Fig. S4B. The number of cells is shown measured 7 days after induction compared to the plating density at day 0 (n = 3 technical replicates for each independent cell line). (E) Comparison of tetracycline derivatives in iPSC line AG02261. Dox was compared to tetracycline derivatives in its ability to rescue endoderm induction. Minocycline and methacycline showed a similar ability to rescue endoderm at the 1-μM concentration with toxicity at the 10-μM concentration. Demeclocycline showed a similar trend. The number of cells is shown measured 7 days after induction compared to the plating density at day 0 (n = 3 technical replicates for each independent cell line). (F) Mitotracker Green analysis of 24-hour induced endoderm including immunofluorescence (scale bar = 1,000 μM) for representative line AG16104-5 and quantifications for three cell lines (n = 4 technical replicates for each cell line). (G) Mitotracker Green analysis of 24-hour induced endoderm with low-dose titration of Dox in line 1023-5 (n = 4 technical replicates for one cell line). Data analyzed by Student t test or two-way ANOVA and presented as mean ± SD. *P < 0.05; **P < 0.01; ***P < 0.001; ****P < 0.0001. Abbreviation: OCT, octamer binding transcription factor.
