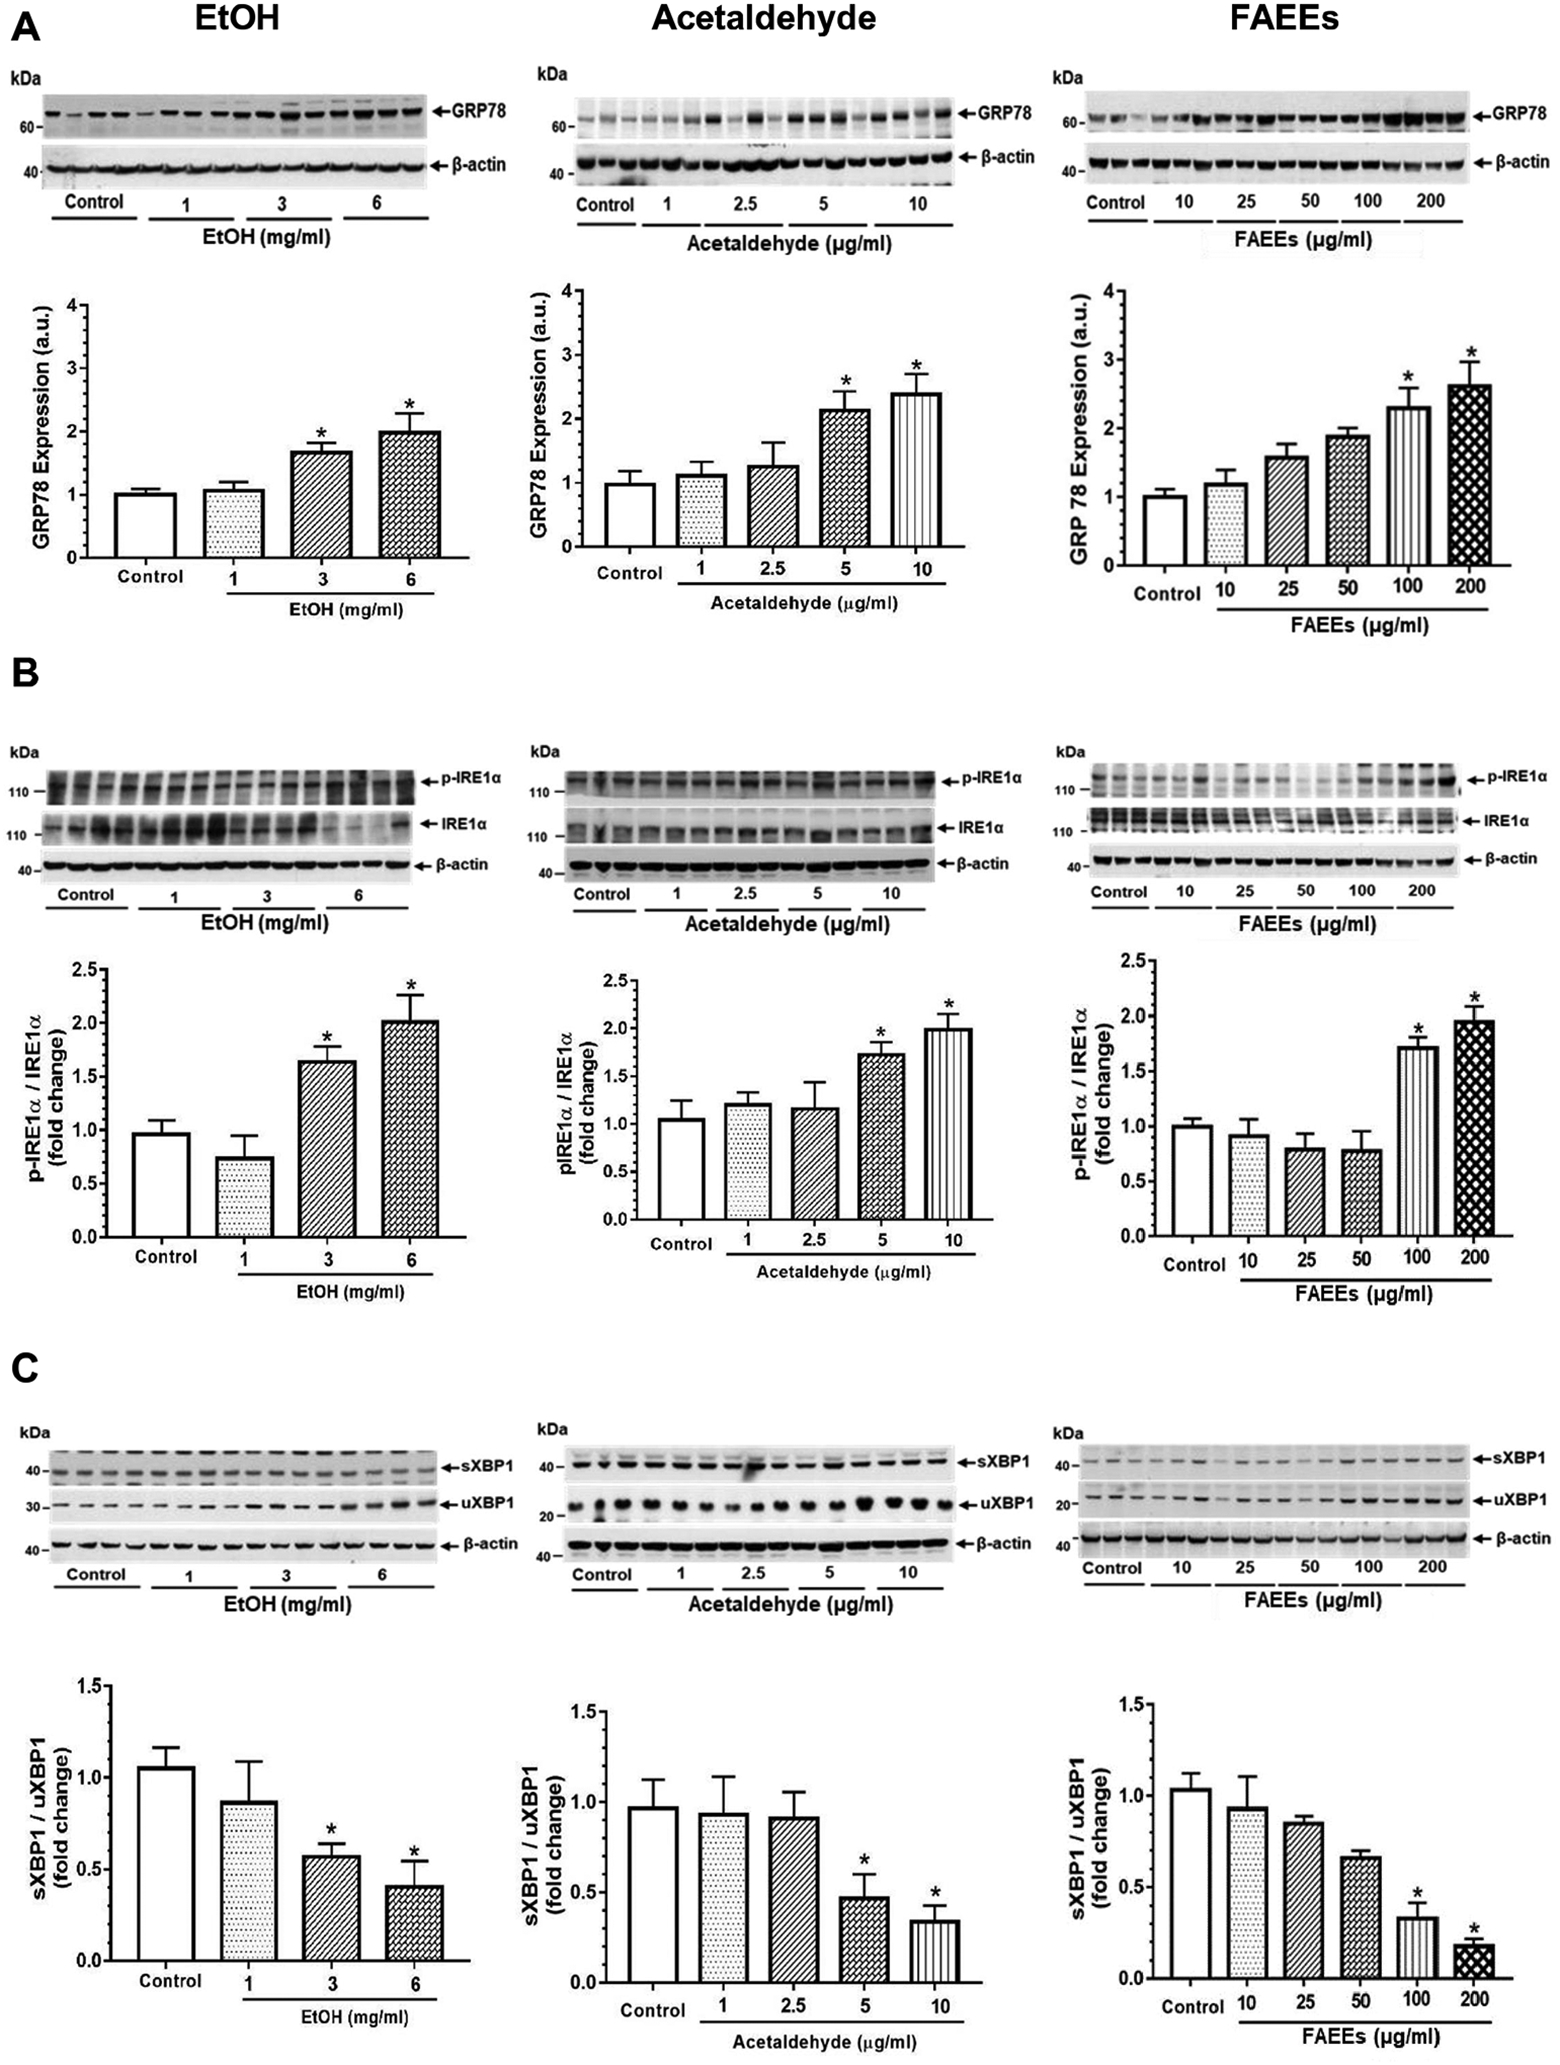
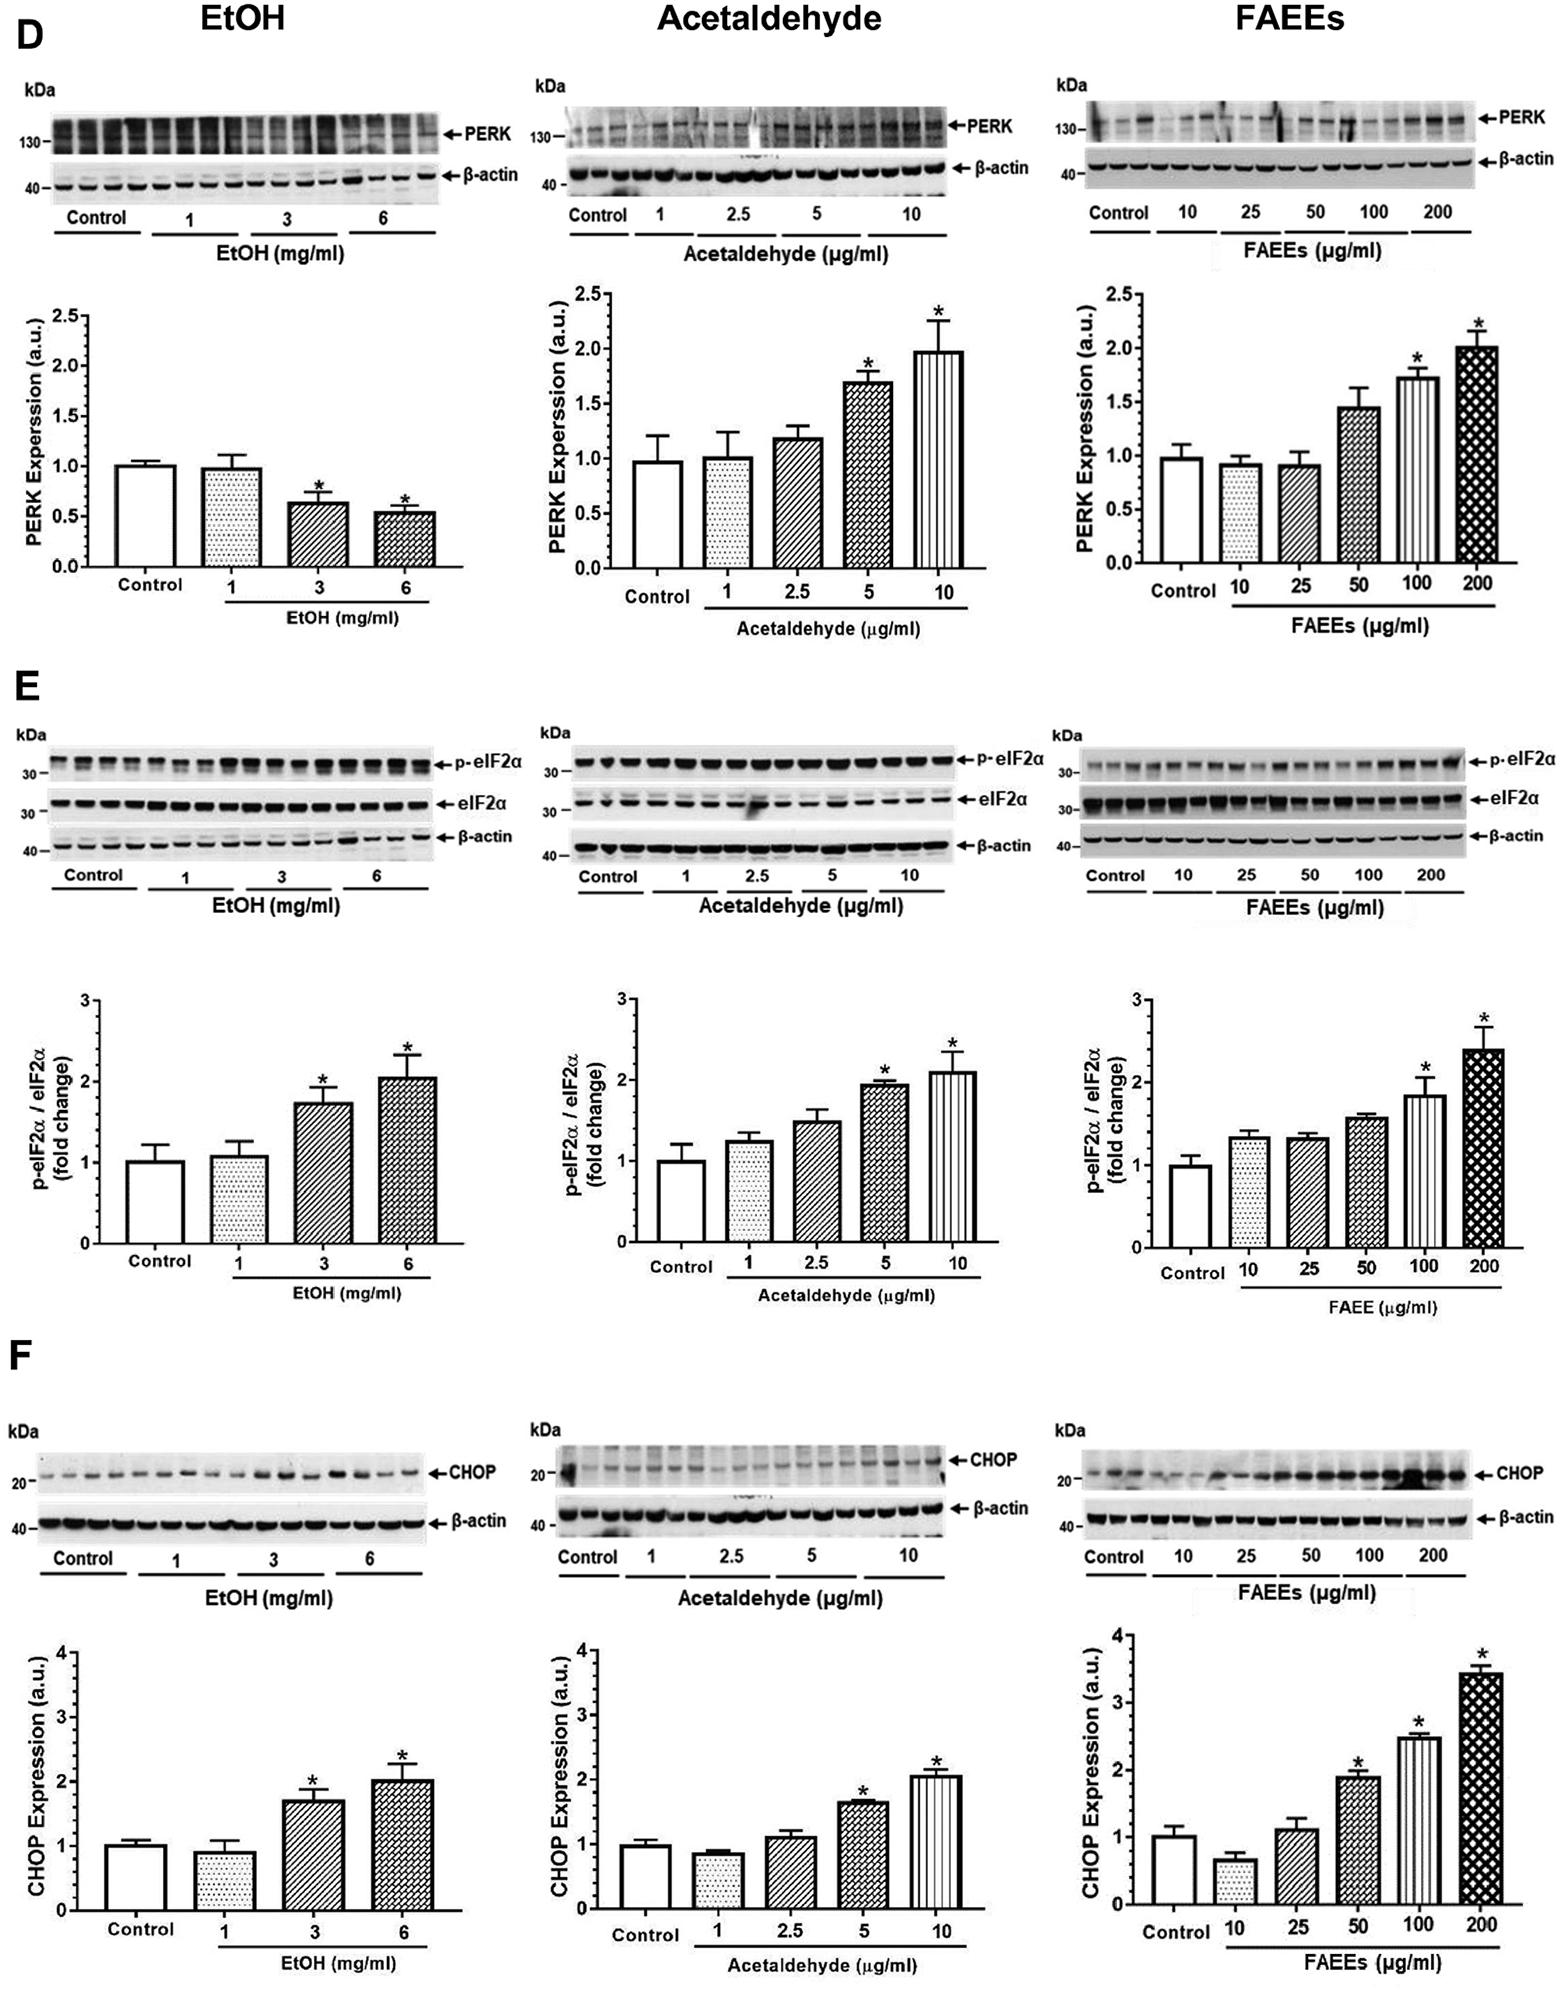
Fig. 4.


ER stress signaling in hPACs treated with EtOH (left panel), acetaldehyde (middle panel) and FAEEs (right panel) for 6hr. Representative immunoblots along with respective bar diagram show expression of GRP78 (A), p-IRE1α/ IRE1α (B), sXBP1/uXBP1 (C), PERK (D), p-eIF2α/eIF2α (E) and CHOP (F). Intensities were normalized to β-actin (loading control). Values are expressed as Mean ± SEM (n =12 replicates). * p value ≤ 0.05 with respect to controls.
