Figure 2.
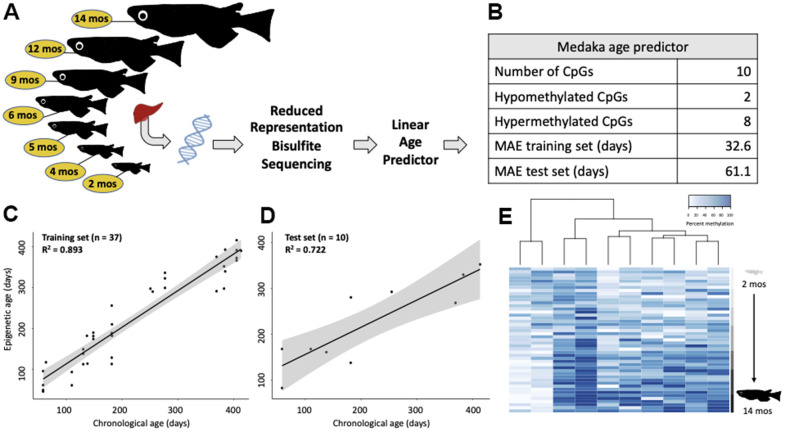
Construction of an epigenetic age predictor in medaka. (A) Conceptual diagram of the RRBS experiment. (B) Description and performance metrics of the medaka epigenetic clock. (C) Performance of the epigenetic clock on the training set (n=37) and (D) test set (n=10). (E) Heat map of the methylation of the 10 clock cytosines. Age is specified by color intensity (2-month: light gray to 14-month: black).

