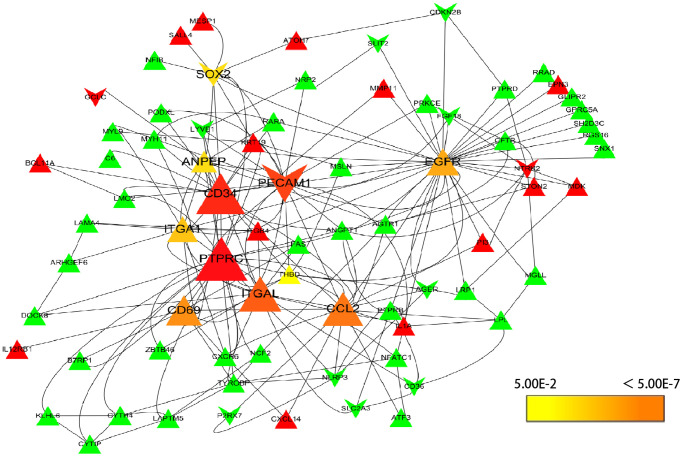
Figure 3.
Selection of hub genes. PPI network was analyzed by cytohubba, a plugin of Cytoscape. A node represents a gene. The genes reduced in NSCLC tissue were shown in green color. The genes increased in NSCLC tissue were shown in red color; at the same time, the genes which down-regulated in A549 by resveratrol were posted in triangles, and the genes which up-regulated by resveratrol were posted in shape “V”. The hub genes with higher scores were demonstrated with larger size.

