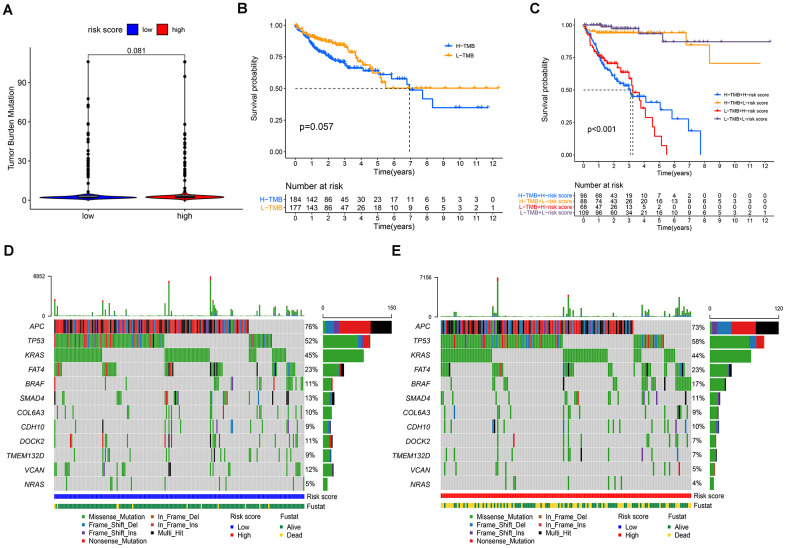
Figure 9.
Correlations between the risk score model and somatic variants. (A) TMB levels between the high- and low-risk groups; (B) correlation between TMB and prognosis in patients with COAD; (C) prognostic predictive value in different TMB subgroups; (D, E) the mutation rates of reported prognostic-related genes in low- and high-risk groups.

