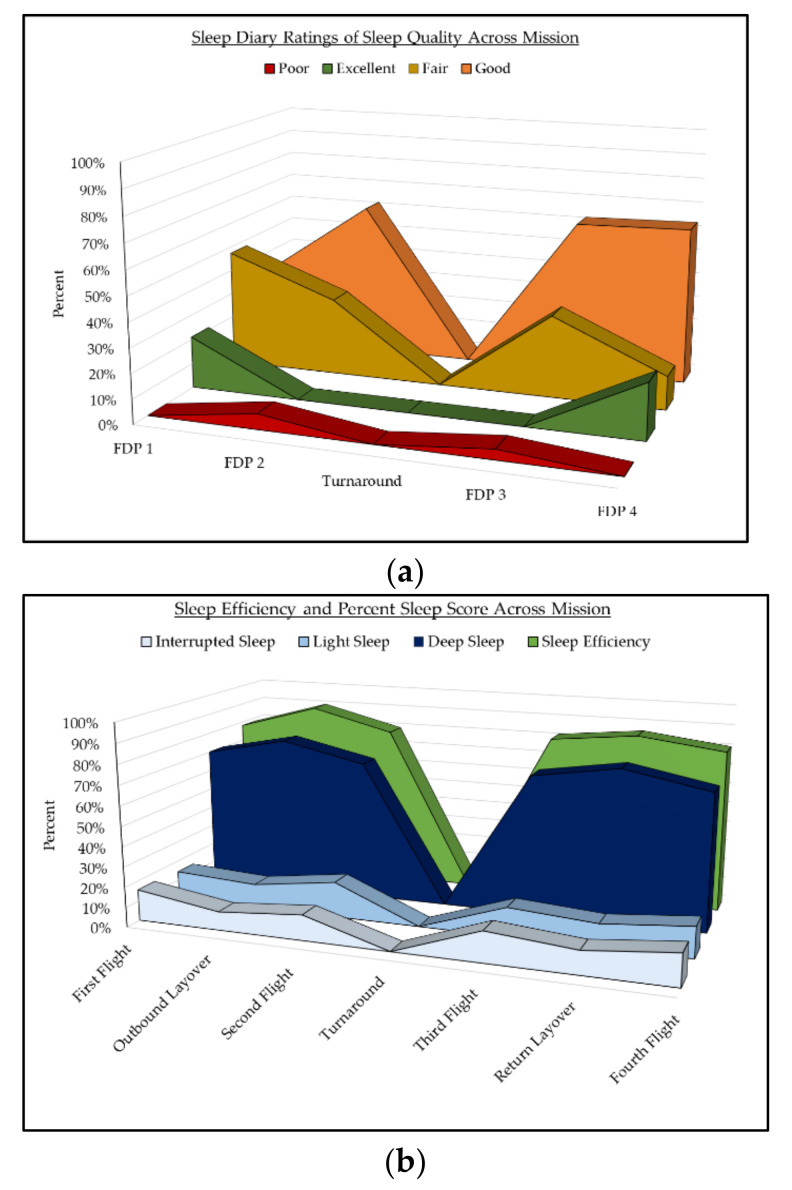
Figure 2.
Subjective Sleep Quality, Sleep Efficiency, and Sleep Score Across Mission Flight Legs. (a) Diary reports of sleep quality during in-flight sleep across all missions FDPs. Pilots only reported sleep quality during in-flight sleep. The graph depicts “Excellent” sleep in green, “Good” sleep in orange, “Fair” sleep in yellow, and “Poor” sleep in red. The breakdown of sleep quality ratings by percentage are reported for each flight leg. (b) Sleep efficiency and sleep score categories as measured by Zulu watch.

