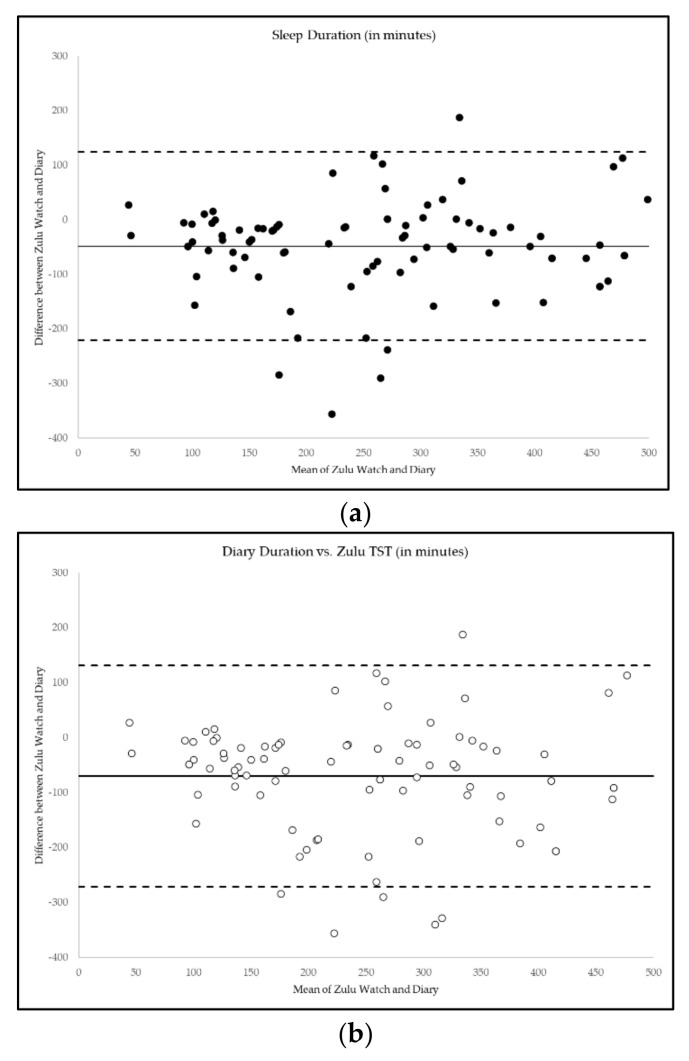
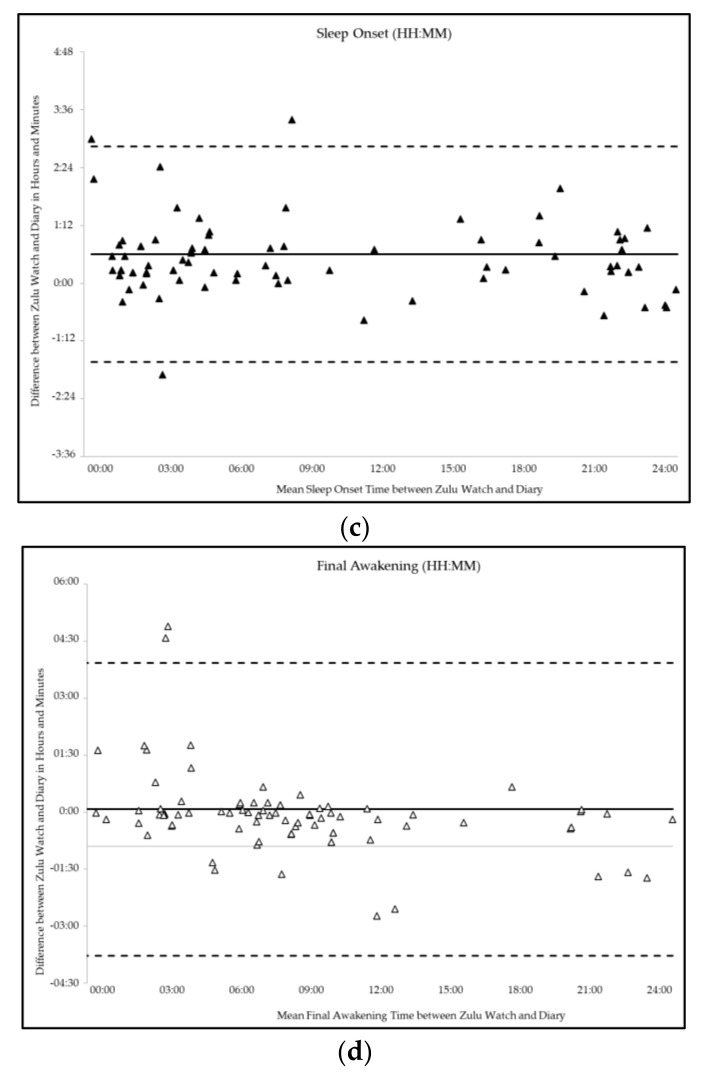
Figure 3.
Agreement between Zulu Watch and Diary Measures of Sleep Timing and Duration. (a) Bland-Altman plots of the differences (y-axis) between the Zulu watch and diary measures of sleep versus the mean of the two measurements (x-axis). Bias is represented by the solid line (―). Upper and lower limits of agreement (LOAs) are represented by the dashed lines (- -). Narrower LOAs indicate relatively less variability between measures. Agreement is shown for (a) Zulu watch and diary measures of sleep duration (●); (b) Zulu watch TST and diary sleep duration (◦) (c) time of sleep onset (▲); (d) time of final awakening (Δ).


