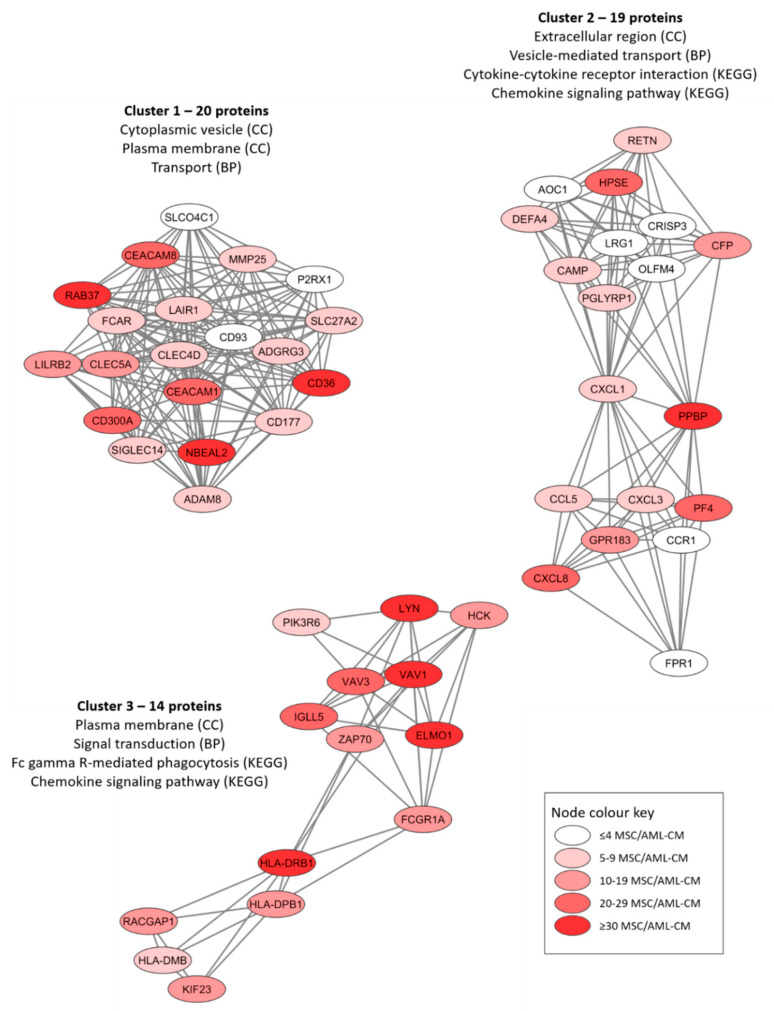
Figure 4.
Three networks/subclusters of densely connected AML-induced MSC proteins. The networks were identified by the MCODE application in Cytoscape from a protein-protein interaction network analysis in String, and these analyses were based on 301 MSC proteins that could be quantified in MSCs only after exposure to AML conditioned medium (AML-CM) (see Figure S4 for the overall network results). The figure presents the most significant GO-terms/KEGG pathways for each cluster/network, and the color coding indicates the number of patients/samples with quantifiable levels for each individual protein (see lower right box).

