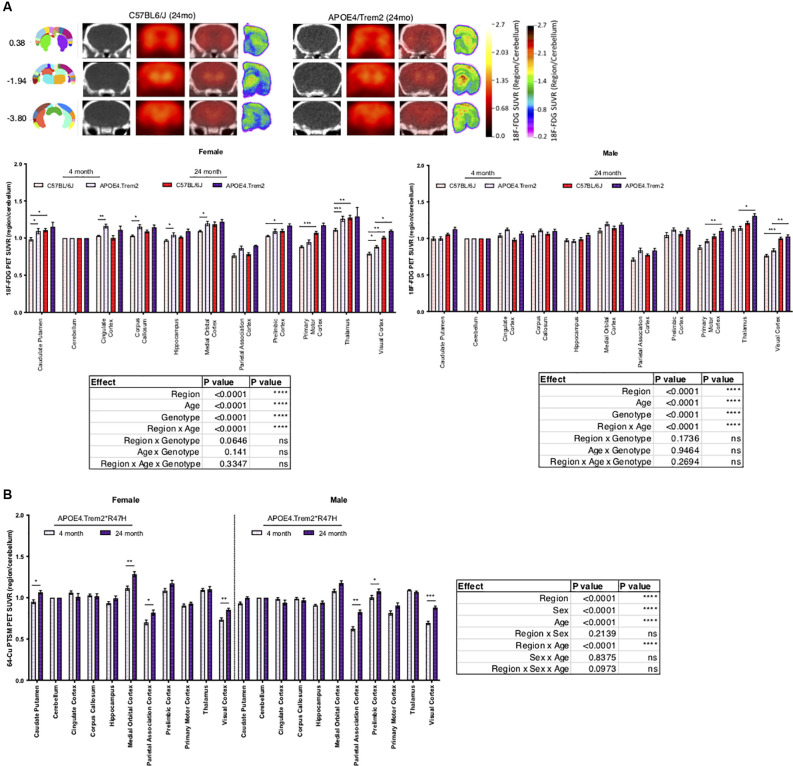
Figure 3.
Increases in regional glucose metabolism due to expression of APOE4 and Trem2*R47H. Positron emission tomography (PET; red scale) of radioactive 18F-FDG marker was used to measure tissue glucose uptake, guided by computed tomography (CT; black and white) mapping to brain regions of interest, indicated by bregma coordinates (far left) (A). PET-CT of 64-Cu PTSM of female and male B6.APOE4.Trem2*R47H mice revealed age-driven increases in brain perfusion (B). Post-mortem autoradiography of coronal brain tissue is represented in (A) (rainbow; far right). Genotype- and age-dependent differences determined by three-way ANOVA. Factor effects and effect interaction are displayed in tables. *p < 0.05; **p < 0.01; ***p < 0.001. All alleles expressed were homozygous.

