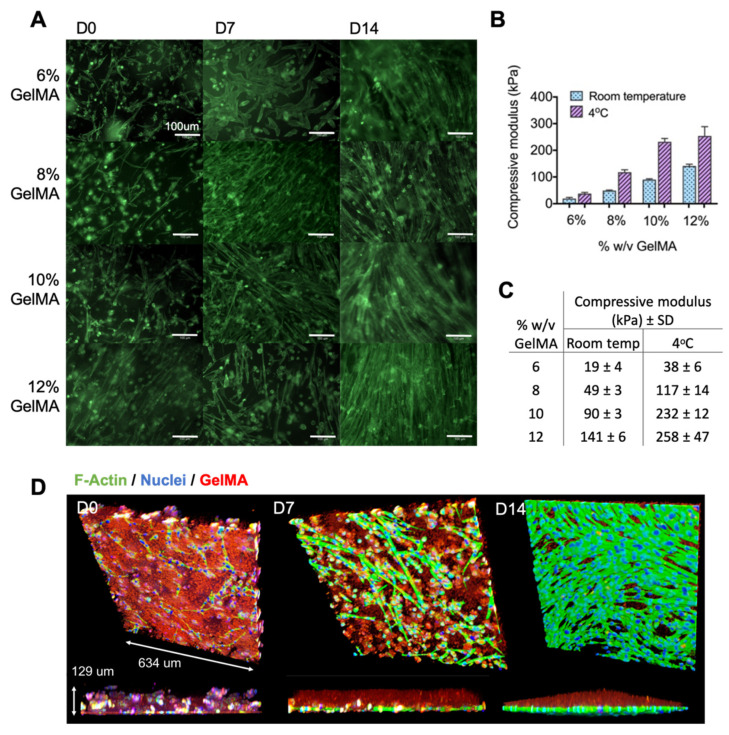
Figure 1.
Characterization of GelMA concentrations. (A) Myoblasts were encapsulated in 6%, 8%, 10%, and 12% w/v GelMA and differentiated over 14 days to establish the optimal formulation for myo-regenerative cells. Samples were fixed and stained for F-actin at days 0, 7, and 14, revealing similar myotube morphology in all concentrations. (B,C) Compressive moduli of the different percentages of GelMA samples at room temperature and at 4 °C, measured without cells. Error bars represent standard deviation. (D) The 3D rendered confocal images of myoblasts encapsulated in GelMA, with images taken at days 0, 7, and 14 of differentiation. A total of 8% w/v GelMA was chosen as a representative sample. Myofibers were stained for F-actin (green) and DNA (blue), and GelMA was demarcated with red fluorescent latex beads. These images demonstrate the migration of myoblasts to the boundary of the material, where they subsequently differentiated into multinuclear myotubes.

