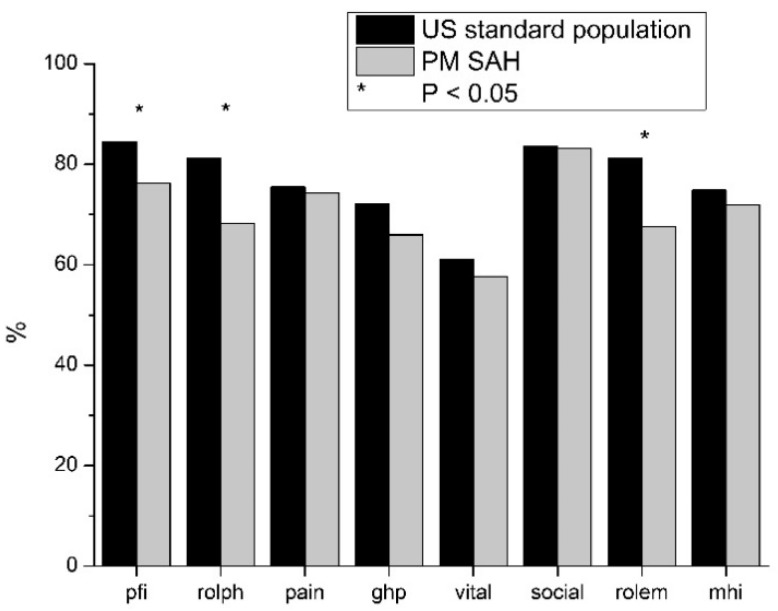
Figure 2.
Comparison of outcome of patients with PM SAH and standard population. Long-term outcome compared to standard population, measured by SF-36. On the x-axis, the eight items of the SF-36 are shown, and the y-axis is scaled metrically. Standard population (black) was compared with PM SAH (grey). At long-term outcome, Pfi, rolph and rolem are significantly reduced after PM SAH compared to the standard population.

