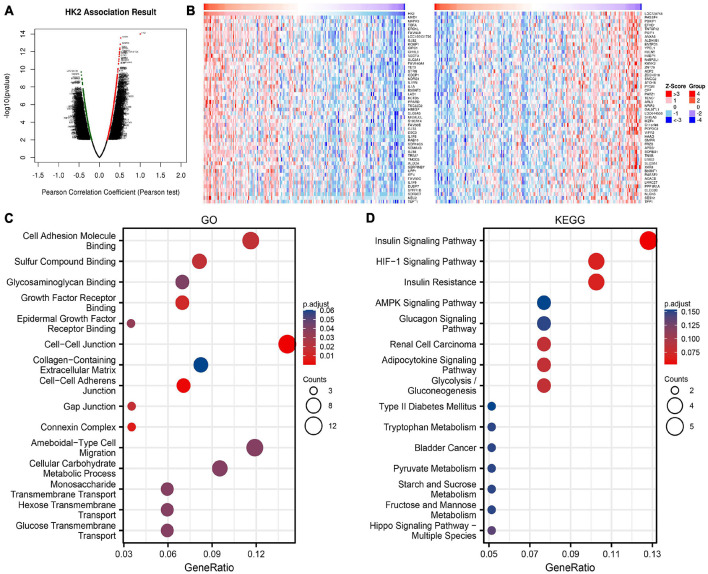
FIGURE 3.
Enrichment analysis of HK2 gene co-expression network in esophageal carcinoma (ESCA). (A) The co-expressed genes related to HK2 expression in TCGA ESCA cohort were shown by volcanic map. (B) The first 50 co-expressed genes positively and negatively correlated with HK2 expression were shown by heat map. (C) Enrichment of gene ontology (GO) terms for HK2 co-expression genes. (D) Enrichment of Kyoto Encyclopedia of Genes and Genomes (KEGG) terms for HK2 co-expression genes.

