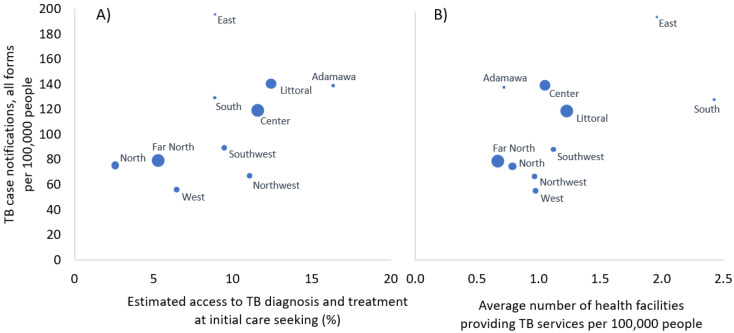
Figure 4.
Scatter plots comparing TB case notification rates to the (A) average number of health facilities providing TB services and (B) estimated access to TB diagnostic and treatment services at initial care-seeking per 100,000 inhabitants; the size of the circles for each region is proportional to the regional populations.

