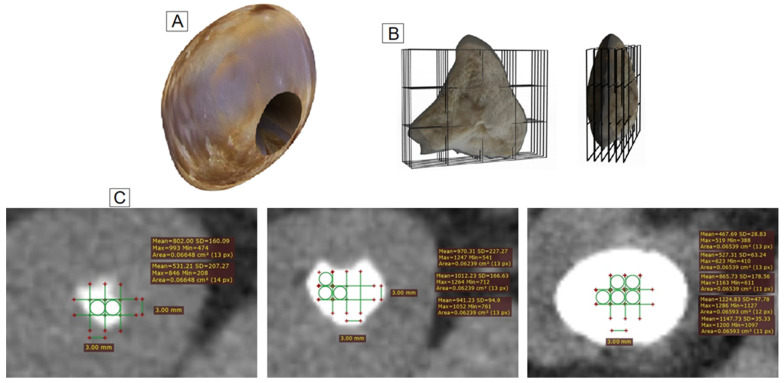
Figure 2.
Representative diagram of the systematic method to obtain the HU in the samples. (A). Renal stone after percutaneous nephrolithotomy. (B). Sample (a small part of the stone) with the superimposed grid and moved in the axial plane (every 1.2 mm). (C). Tomographic images, with superimposed grids, of a cortex, middle and nucleus, respectively.

