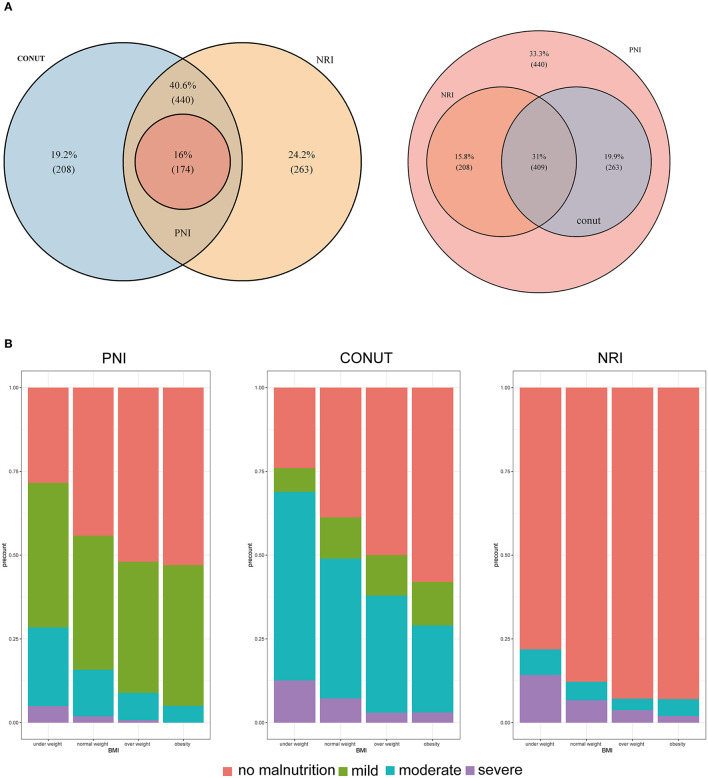
Figure 1.
(A) Venn diagram. The numbers reported in each circle indicate the cumulative frequency of malnutrition (any degree [left] vs. no-malnourished [right]) according to each malnutrition index. (B) Percentage of malnutrition by subgroups of patients according to body mass index. CONUT: Controlling Nutritional Status score, PNI: prognostic nutritional index, NRI: nutritional risk index.

