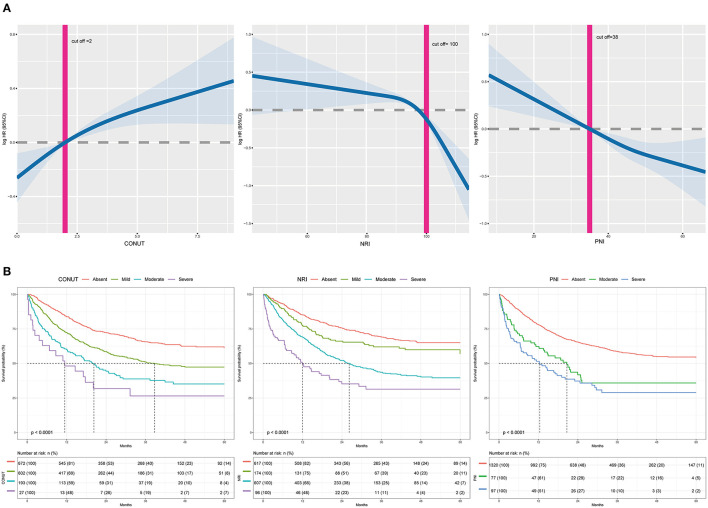
Figure 2.
(A) The incidence of all-cause mortality is shown after adjusted for age, gender, BMI, comorbidities disease, smoking, alcohol, tumor location, tumor stage, chemotherapy, immunotherapy, surgery, parenteral nutrition intervention, enteral nutrition intervention, ECOG, handgrip strength, and EORTCQLQ-C30. For NRI, total cholesterol and lymphocyte count were adjusted additionally. For PNI, lymphocyte count was adjusted additionally. The x-axis shows the score of each malnutrition index. The curve shows the incidence, with 95% CI, of the estimates. (B) Kaplan-Meier curves for all-cause mortality by the category of each malnutrition index in elderly patients with cancer. CONUT, Controlling Nutritional Status score; PNI, prognostic nutritional index; NRI, nutritional risk index.

