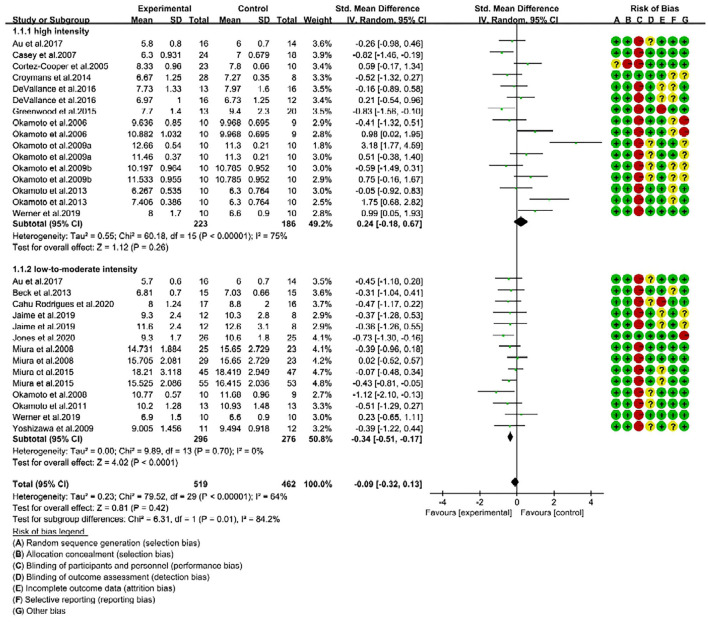
Figure 2.
Forest plot of pulse wave velocity (PWV) changes with different intensities of RE in adults (m/s). SD, standard deviation; IV, inverse variation; CI, confidence interval; df, degrees of freedom. Risk of bias: green (+) indicates low risk of bias; red (–) high risk of bias; and yellow (?) unclear risk of bias.

