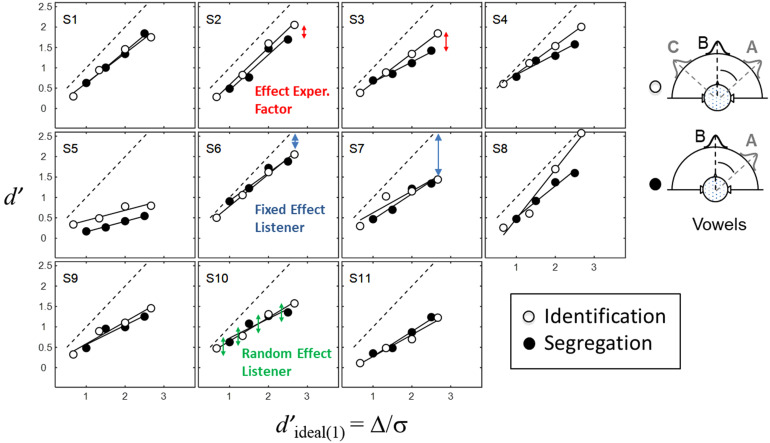
Figure 1.
Listener d′ performance is plotted against Δ/σ for 11 listeners (panels) for both the talker segregation (filled symbols) and identification (unfilled symbols) tasks of Experiment 1. The continuous lines drawn through the data are linear least-squares fits. The dashed line is the performance of an ideal observer for a single A–B difference in F0 or θ (see text for explanation).

