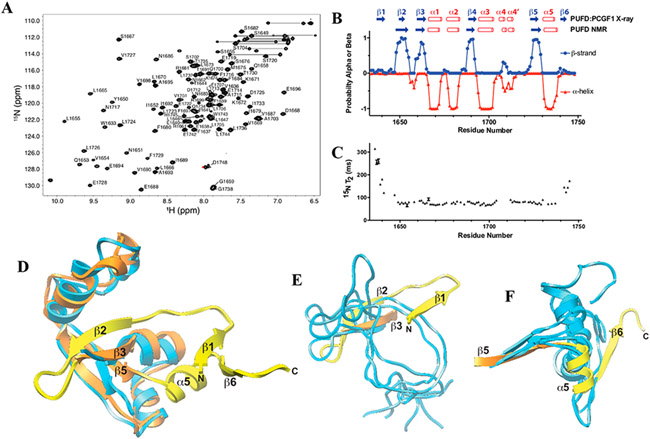
Figure 4.
NMR structure and dynamics of BCOR PUFD. (A) Heteronuclear 1H–15N shift correlation spectrum of the BCOR PUFD (S1634–D1748) in 10 mM Tris-HCl, 50 mM NaCl, 1 mM TCEP (pH 8.0), and 5% D2O with labeled backbone amide signals. (B) Secondary structure probabilities deduced from the assigned chemical shifts using the program PECAN.26 A comparison with the BCOR PUFD secondary structure observed in the BCOR PUFD:PCGF1 RAWUL complex crystal structure (PDB entry 4HPL) is shown at the top. (C) BCOR PUFD backbone 15N T2 relaxation times derived by measuring relative peak intensities in 2D 1H–15N shift correlation spectra at eight different T2 relaxation times and by fitting these to a single exponential. Errors shown were estimated on the basis of Monte Carlo analysis of the measured relative intensities for each residue. The shorter relaxation times measured for residues in the core serve as internal controls for the longer times measured for the terminal residues. (D) Overlay of one representative model of the BCOR PUFD NMR solution structure (blue) on the BCOR component of the PCGF1 RAWUL:BCOR PUFD crystal structure over the structurally ordered core. The ensemble of 10 lowest-energy BCOR PUFD NMR structures has a pairwise RMSD over this region of 2.54 Å (Table 1) and as shown is in good agreement with the PCGF1 RAWUL:BCOR PUFD crystal structure (RMSD of 2.68 Å for the comparison shown). Regions of the BCOR PUFD of the crystal structure that extend beyond the core are colored yellow. (E and F) Same overlay of the BCOR PUFD cores as in panel D, but showing just the (E) N-terminus and (F) C-terminus of five representative BCOR PUFD solution structure models.

