
Figure 4. Experiment 4 Results.
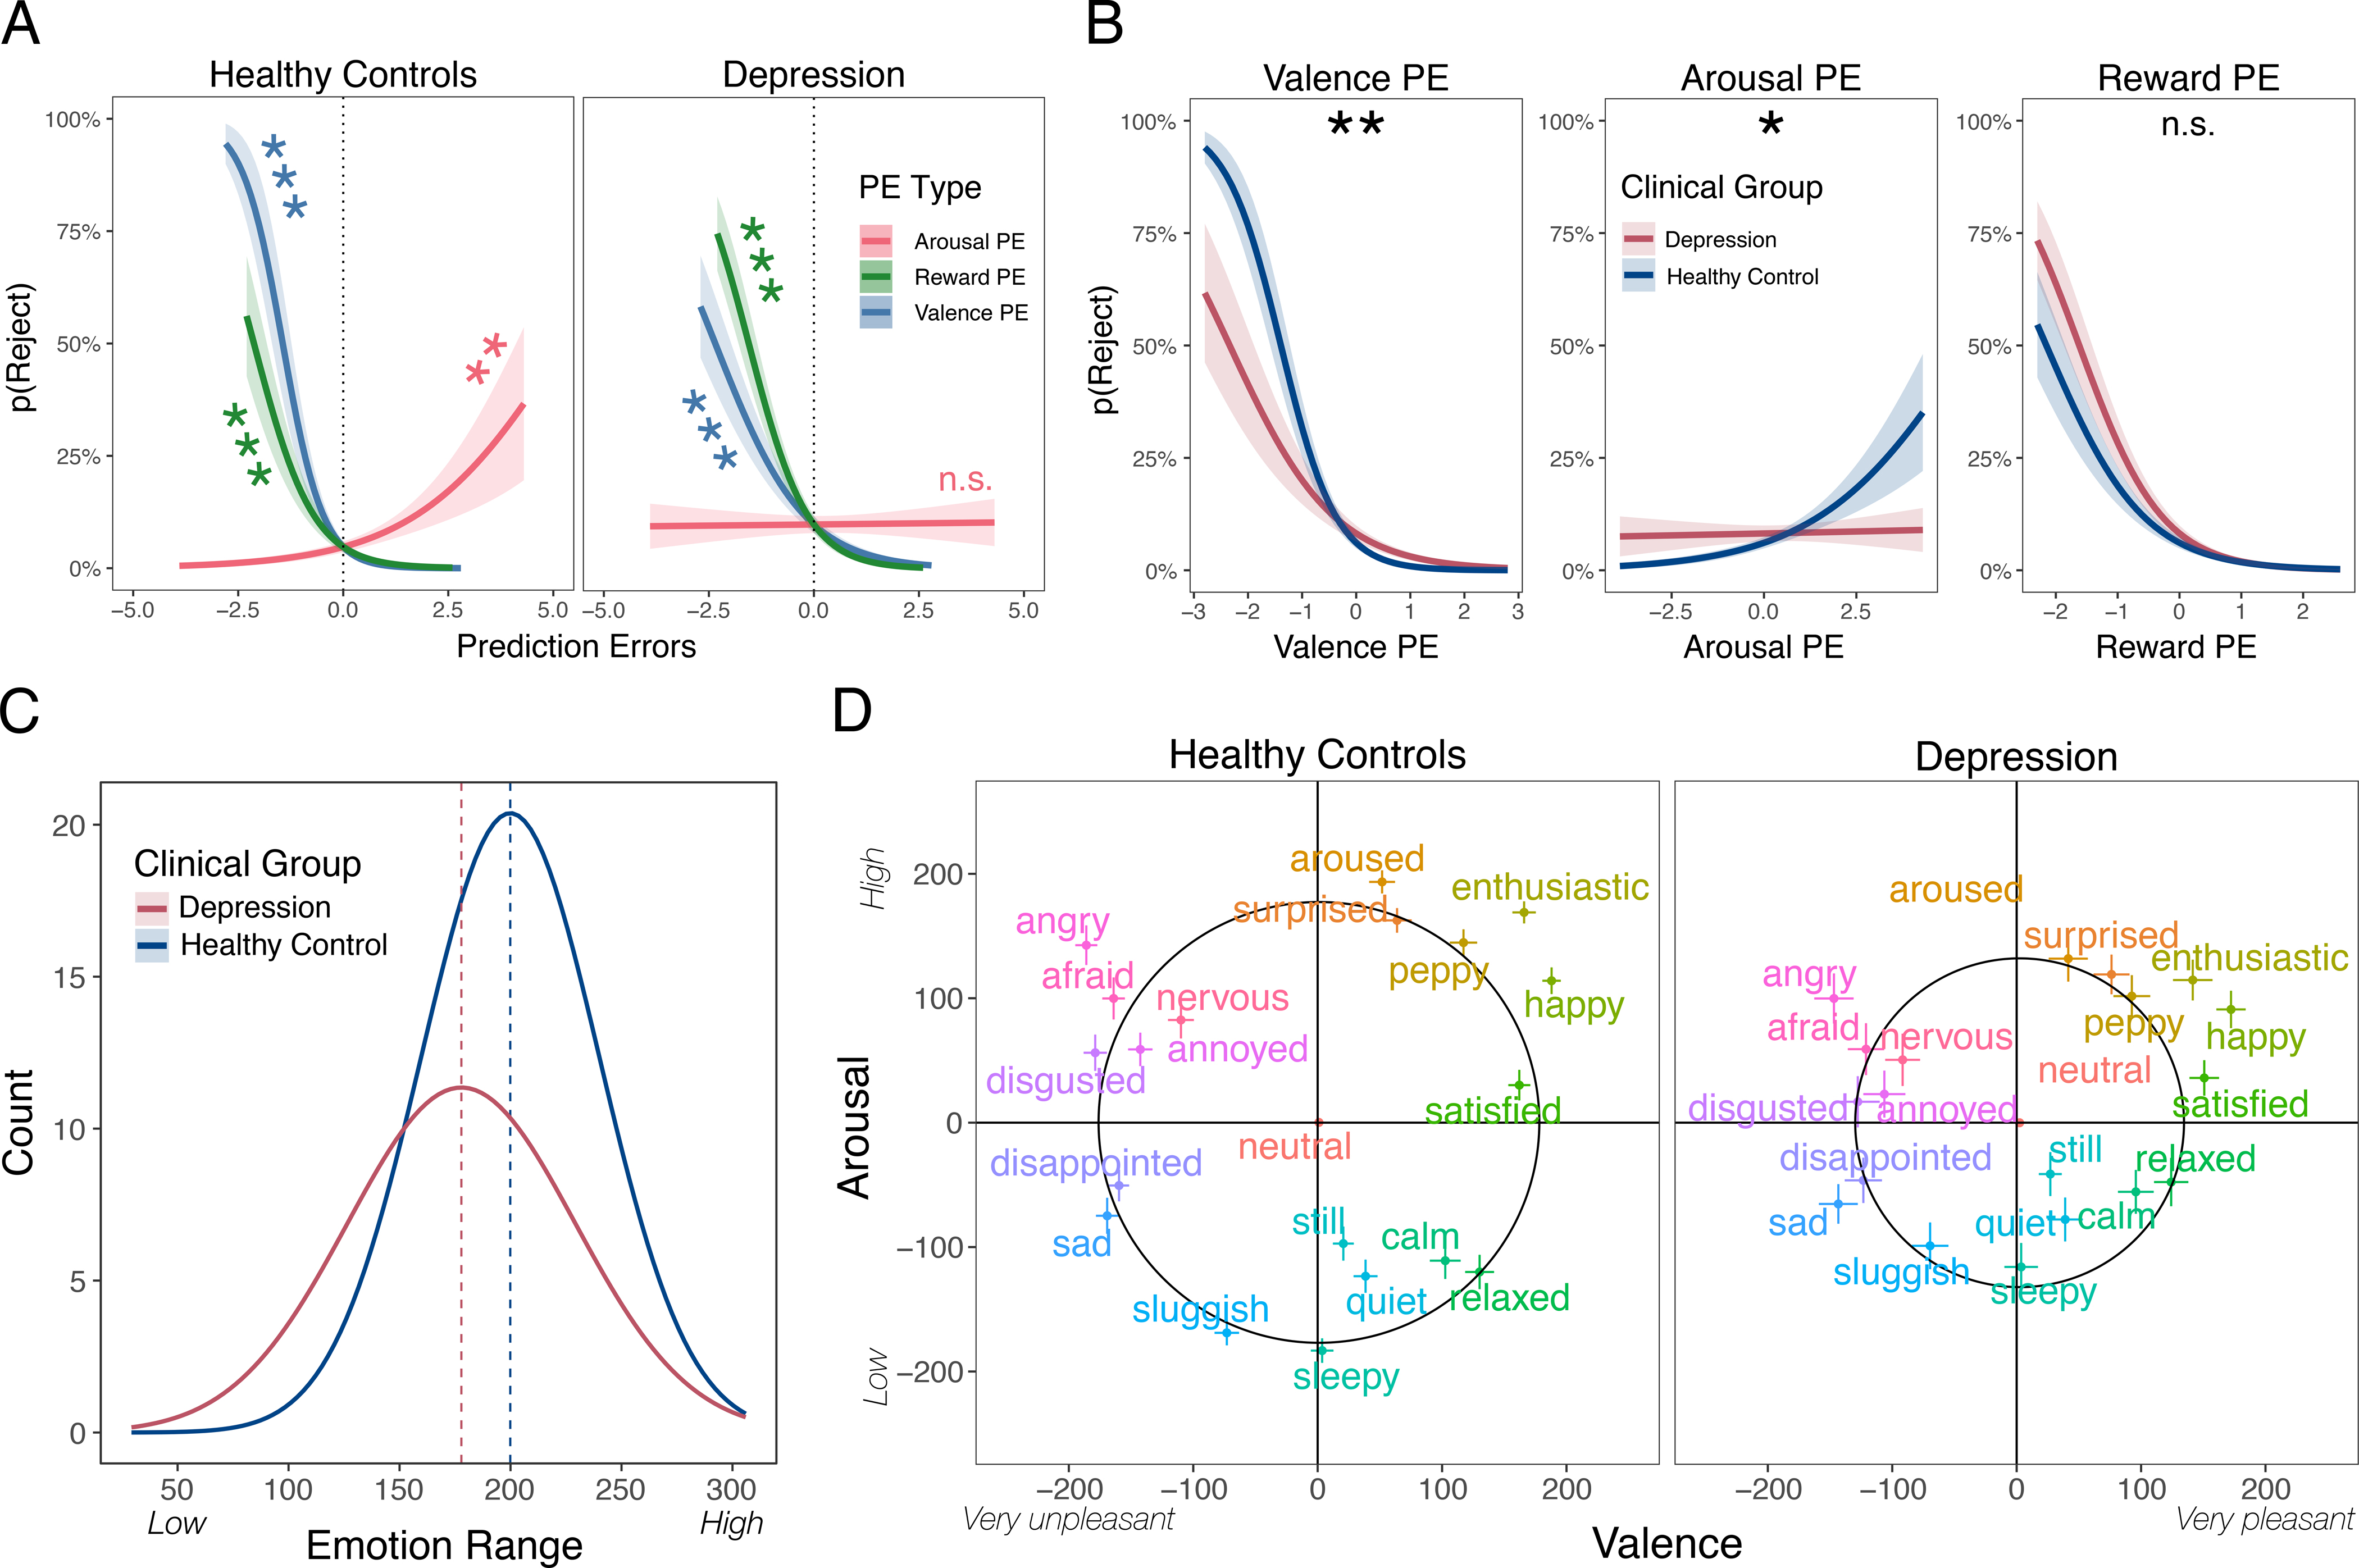
A) Prediction error use in healthy controls and those at risk for depression. The probability of Rejecting the offer is plotted for all three types of prediction errors: reward, arousal, and valence for healthy controls (left) and those reporting significant levels of depression (right). Negative values reflect negative prediction errors, while positive values reflect positive prediction errors. Analyses represent separate regression effects. Shaded areas reflect ±1 SE. B) Prediction errors plotted by group. The use of each prediction error is plotted for both healthy controls and individuals at risk of depression. Analyses represent interactions between each prediction error and group. C) Emotion range. Each participant’s emotion ratings were used to calculate the average distance of their ratings from neutral (i.e., the radius of their unique circumplex), thereby indexing their emotional range. Histograms represent normal distributions for both groups and dashed lines indicate their respective means. D) Group-level average emotion ratings. Participants rated 20 typical emotions using the dARM and the circles represent emotion range fits for each group. Error bars represent 95% CIs. Shaded areas reflect ±1 SE. Stars reflect significance at p < .001***, p < .01**, p < .05*.