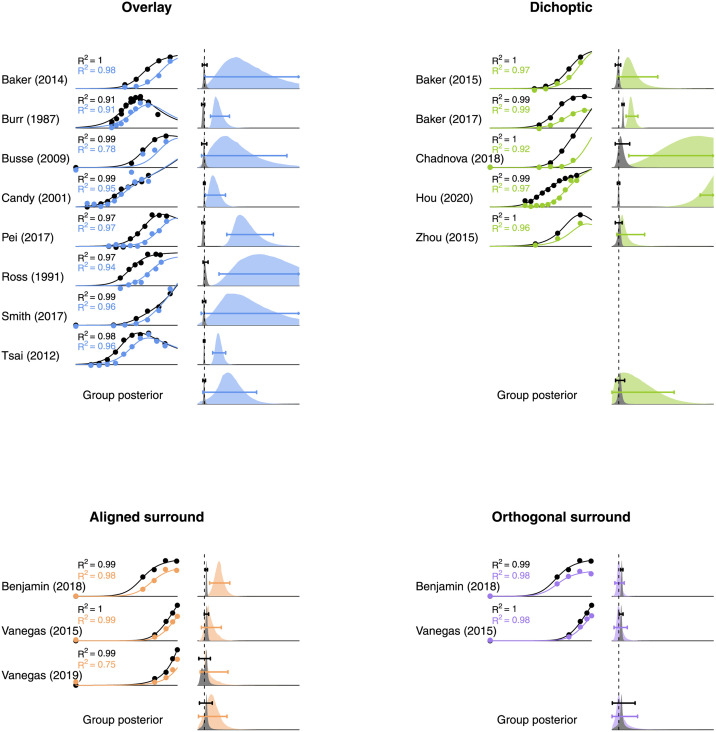
Fig 2. Computational meta-analysis of 16 studies from the literature reporting SSVEP measures of suppression.
Each study is referred to by the first author surname—see text for full citations. Contrast response functions at baseline (black points) and with a mask present (coloured points) were fit using a two stage modelling procedure (curves). The posterior distributions (vertically rescaled for visibility) of parameter estimates for response gain (grey) and contrast gain (colours) are shown for each study and the group estimates. Vertical dashed lines indicate a parameter value of 1 (the axis extends to x = 15). Horizontal bars give the 95 percent highest density intervals for each parameter estimate. R2 values in each sub-panel indicate the coefficient of determination, calculated separately for the baseline (black text) and masked data (coloured text).

