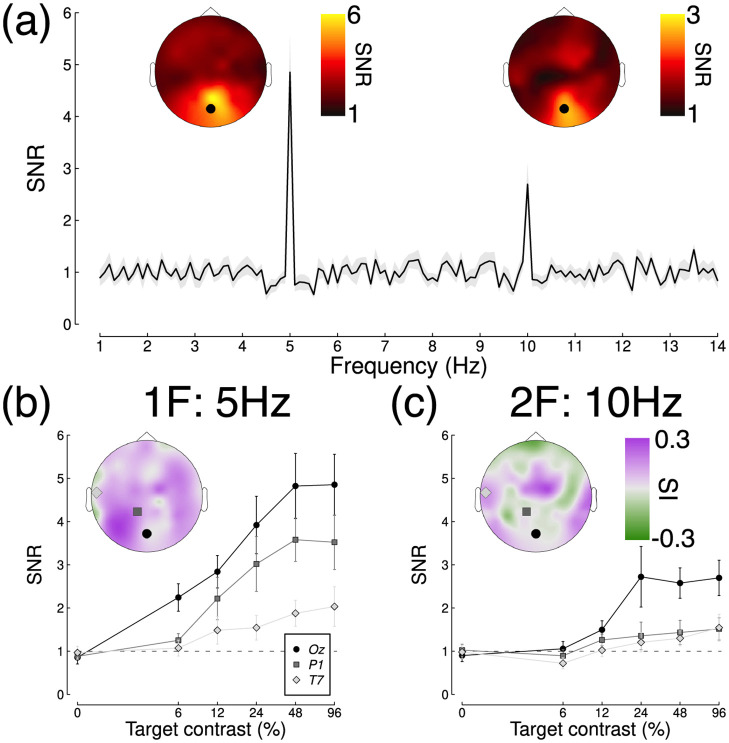
Fig 3. Averaged Fourier spectrum and example contrast response functions.
Panel A shows the spectrum for a high contrast target, with inset scalp plots showing SNRs at the first and second harmonic frequencies. The spectrum is taken from electrode Oz, indicated by the black points in the scalp plots. The shaded region and error bars indicate ±1 standard error. Panels B and C show example contrast response functions at the first and second harmonics at electrodes Oz, P1 and T7, averaged across participants (N = 12). The inset scalp plots show how the saturation index varies across the head.

