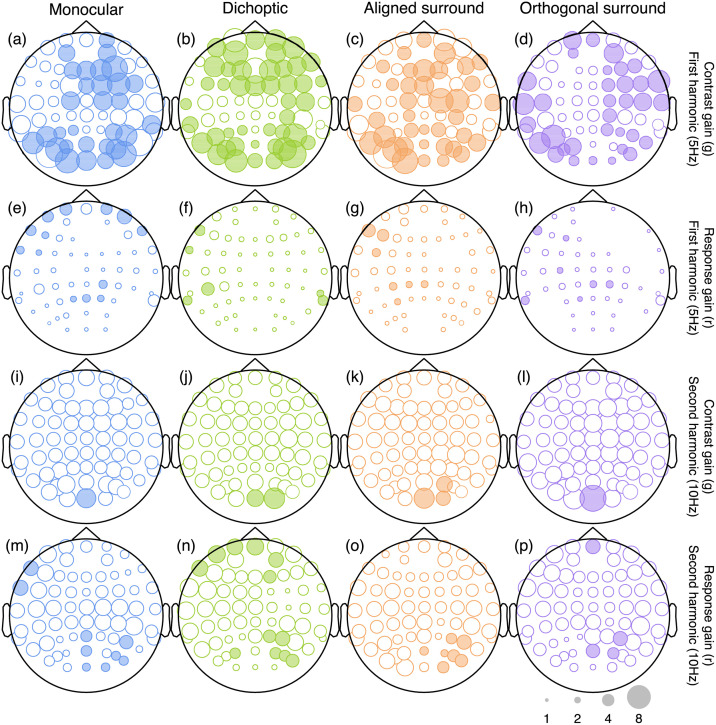
Fig 5. Scalp plots summarising the suppressive weights for contrast and response gain from the Bayesian hierarchical model, fitted to data from the low mask contrast experiment.
Symbols are filled white when the 95 percent highest density interval of the posterior parameter distribution includes 1 (implying no credible contribution from that type of suppression), and shaded when it exceeds 1 (implying credible evidence for suppression). Larger symbols correspond to stronger suppression (see the scale in lower right corner), but parameters implying facilitation (values <1) are not plotted.

