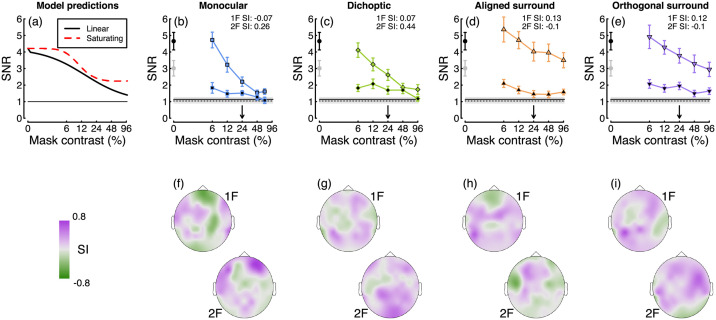
Fig 8. Summary of the effects of varying mask contrast.
Panel A shows the predictions of a gain control model (Eq 1) for different levels of mask contrast. In the linear model (black), the suppressive signal is a linear function of mask contrast. In the nonlinear model (red), the suppressive signal has itself passed through a nonlinear transducer function before suppressing the target. Panels B-E show empirical data for four mask types, at the first and second harmonic frequencies (black borders and black fills, respectively). Error bars and shaded regions show ±1 standard error of the mean across N = 21 participants. Panels F-I show how the modified saturation index varies across the scalp.

