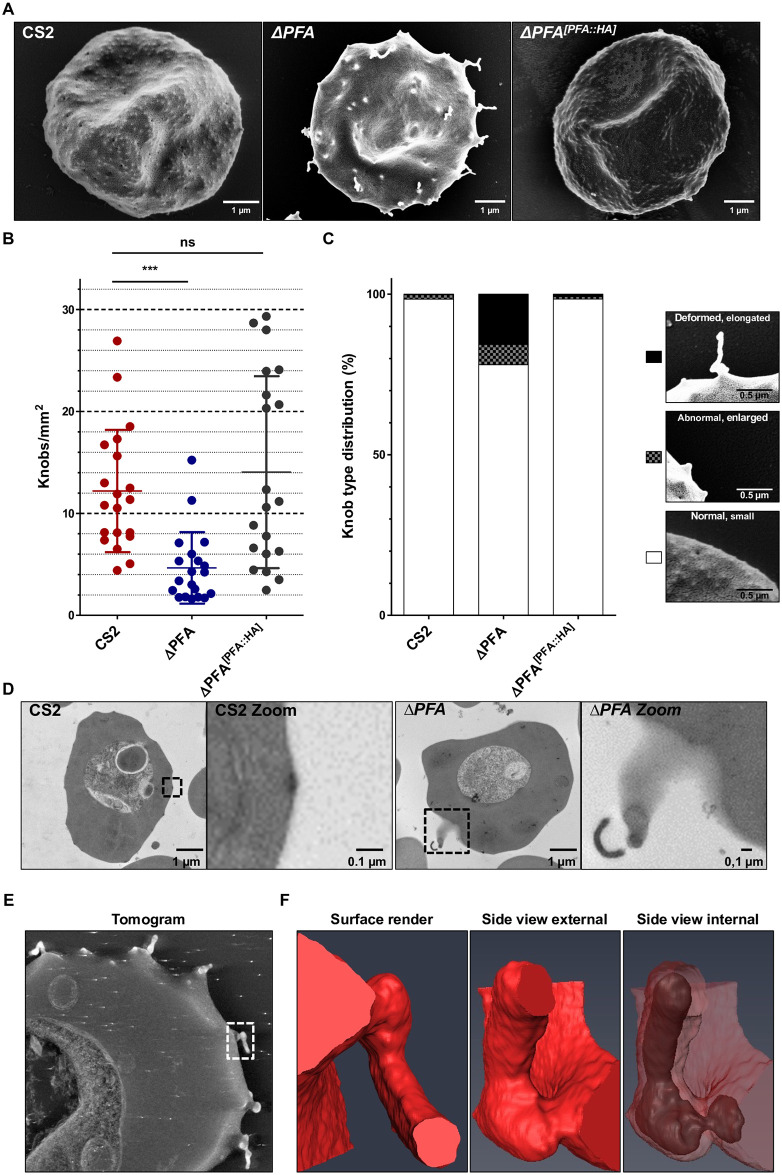
Fig 2. Electron microscopy reveals deformed knob morphologies of ΔPFA iRBCs.
A) Scanning electron microscopy shows knobs on the surface of iRBCs. The mutant phenotype of ΔPFA is alleviated upon reintroduction of episomally expressed PFA66 in ΔPFA[PFA::HA]. More pictures can be found in S2 Fig. B) Quantification of knob density via ImageJ in SEM pictures (n = 20) shows significantly fewer knobs on ΔPFA iRBCs. Knob density is restored in the complementation cell line CS2ΔPFA[PFA::HA]. C) Quantification of knob morphology across all iRBCs. Knobs were grouped into three categories: small knobs, enlarged knobs, and elongated knobs. Then every knob on 20 SEM pictures of the three strains was assigned to one of these categories. Each bar represents the distribution of these knobs in the three categories across all pictures of a strain. The ΔPFA strains display an increase in deformed and enlarged knob morphologies compared to CS2 and ΔPFA[PFA::HA]. D) Internal view of the deformed knobs/eKnob via transmission electron microscopy of thin slices. More pictures can be found in S3E Fig) Electron tomography reveals electron-dense material at the base and interior of deformed knobs/eKnobs. The marked area denotes the structure shown in F. F) 3D segmentation of discrete densities within a deformed knob/eKnob depicted with electron tomography. The example shows a severely deformed knob/eKnob. Additionally, electron dense material was detected at the base and inside of these structures.

