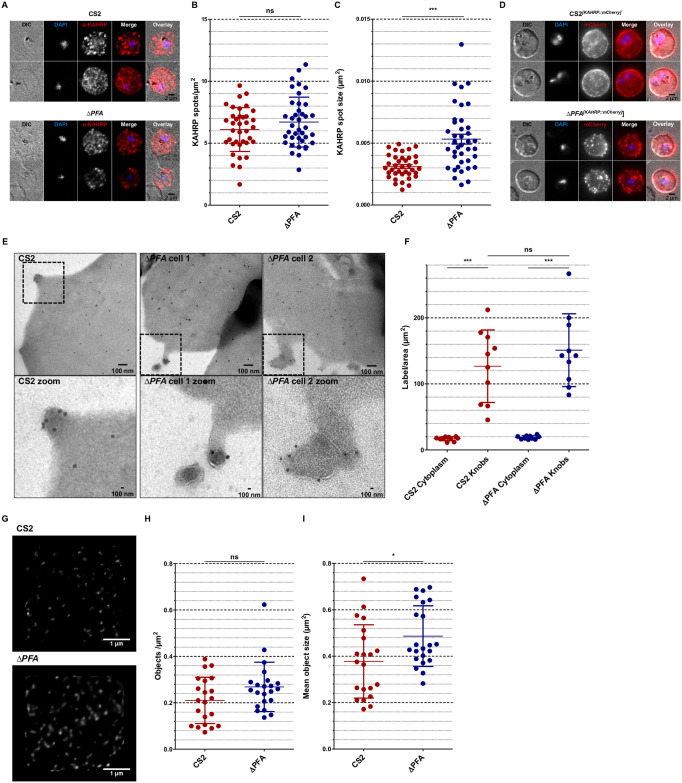
Fig 3. ΔPFA iRBCs display altered KAHRP distribution.
A) IFA assay of MeOH-Ac-fixed CS2 and ΔPFA using α-KAHRP antibodies reveals punctate patterns. A trend was noticed towards bigger spots in the truncation strain and verified using automated measuring via an ImageJ algorithm (See Fig 3 B, C). D) Live cell imaging of DAPI stained CS2[KAHRP::mCherry] and ΔPFA[KAHRP::mCherry]. KAHRP::mCherry can be seen in both cell lines as punctate patterns; however, CS2 displays smaller and more dots. E) Immunogold labelling of iRBC sections in TEM using α-KAHRP antibodies. Images demonstrate label associated with normal knobs and deformed knobs in CS2 and ΔPFA, respectively. Framed areas can be seen enlarged below. F) Analysis of label density associated with the cytoplasm and area surrounding knobs. Label density is significantly higher in the area surrounding knobs than the cytoplasm for both strains. G) STED imaging of the KAHRP associated with the internal RBC cytoskeleton. For this analysis CS2 and ΔPFA iRBCs were bound to a dish and then lysed hypotonically. The cell body was then washed away, and the remaining cytoskeleton remained as it would be seen from the inside of the iRBC. These samples were then interrogated with an α-KAHRP antibody and STED imaging. G) Representative images of the KAHRP patterns observed in STED from the CS2 and ΔPFA cell line. KAHRP signals were often found to be bigger in the truncation cell line. H) Computational analysis of KAHRP signals through a self-made ImageJ tool revealed no difference in KAHRP spot numbers between both cell lines. I) Investigation of mean object size demonstrated a slight increase of KAHRP spot size in ΔPFA.

