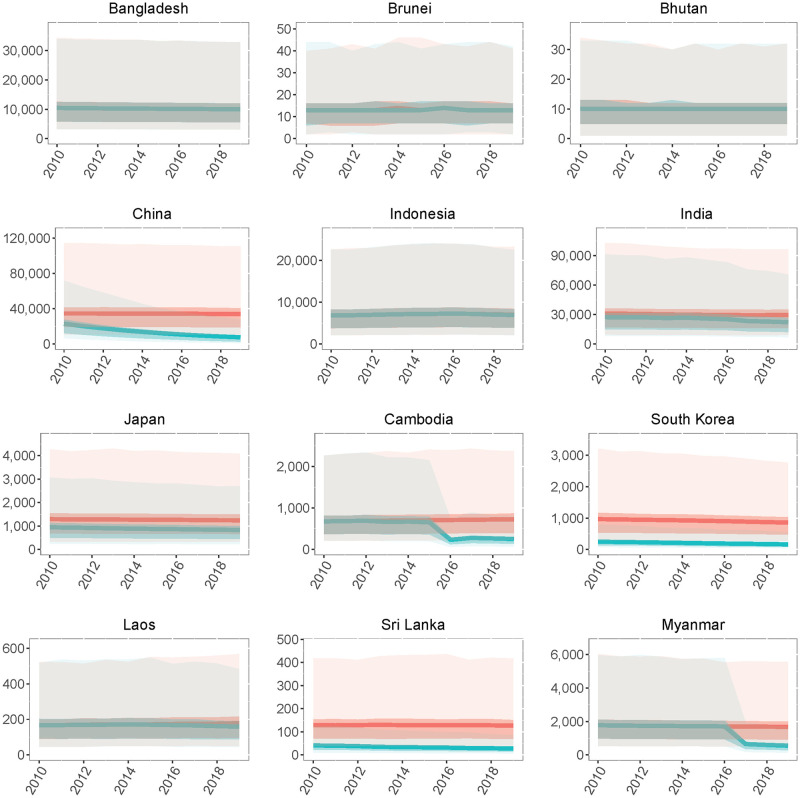
Fig 4. National-level Japanese encephalitis (JE) cases from 2010–2019.
Annual national-level JE cases from 2010 to 2019 with vaccination (blue) or under a counterfactual scenario where vaccination coverage in all countries was zero (red). Darker bands represents the interquartile range (IQR) and lighter bands represents the 95% confidence intervals (CIs).

