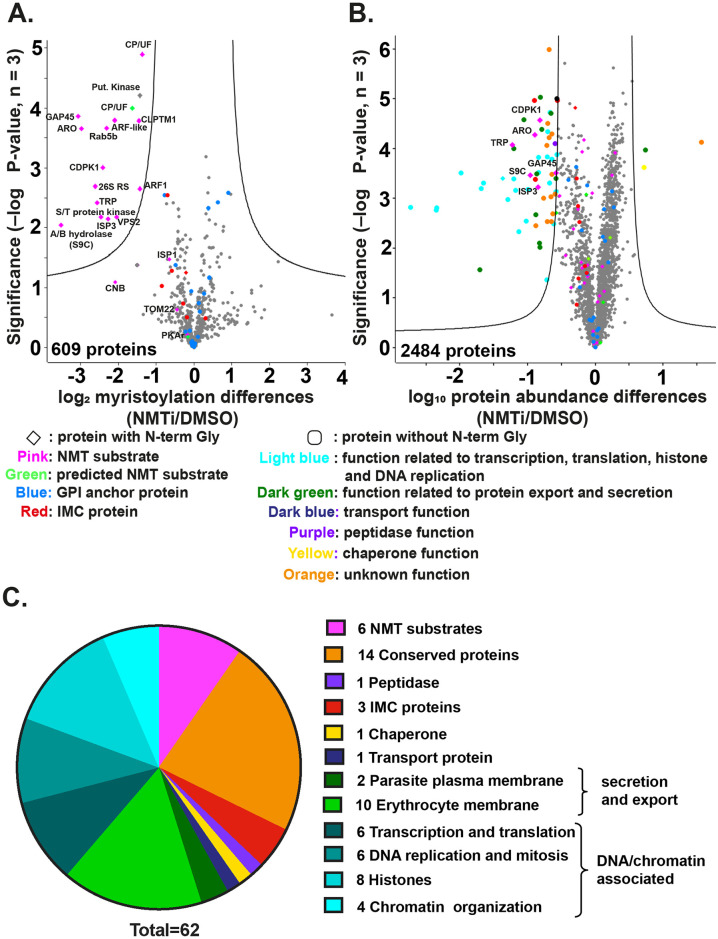
Fig 3. NMT inhibition changes the abundance of both myristoylated and non-myristoylated proteins.
(A) Parasite proteins were metabolically labeled with YnMyr for 11 hours during schizogony, coupled to AzTB and enriched on Neutravidin coated agarose beads. LFQ analysis was used to measure the abundance of enriched proteins labeled in the presence or absence of IMP-1002. A 2-sample t test (permutation-based FDR, 250 permutations [number of randomizations], FDR 0.01, S0 = 0.5 [within groups variance]; n = 3 biological replicates, each with 3 technical replicates) revealed significant differences in myristoylated protein abundance between IMP-1002–treated and control (DMSO) samples. The lines on the graph indicate t test significance cutoff. The identity of some proteins is shown on the plot; symbols and color coding of individual proteins are explained below the plot. Full data are in S2 Data. (B) Quantitative whole proteome analysis using TMT protein labeling to measure protein abundance in parasite samples treated with either DMSO or 140 nM IMP-1002 and subsequent saponin lysis. A 2-sample t test (permutation-based FDR, 250 permutations, FDR 0.01, S0 = 0.8 [within groups variance], n = 3) revealed significant changes in overall protein abundance between the inhibitor-treated and control (DMSO treated) parasites. The identity of some proteins is shown on the plot; symbols and color coding of individual proteins are explained below the plot. Full data are in S3 Data. (C) Pie chart presentation of the 62 proteins significantly reduced in abundance following IMP-1002 treatment of schizonts from 34 to 45 h PI, with their associated grouping based on GO term analysis from PlasmoDB (Release 44, July 2019) The full listing is in S3 Data. FDR, false discovery rate; GPI, glycosyl phosphatidylinositol; h PI, hours postinfection; LFQ, label-free quantification; NMT, N-myristoyl transferase; NMTi, NMT inhibitor; TMT, tandem mass tag.

