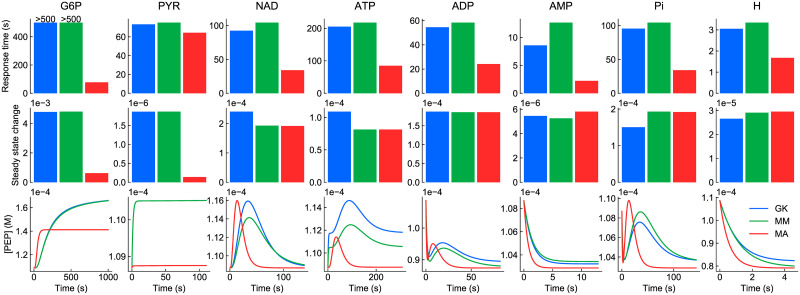
Fig 9. Response of glycolysis models to prolonged perturbations to external species.
Each of the species (column titles) had its concentration instantaneously increased by 30% from steady state. Top row: response times; middle row: steady state deviation; bottom row: change in [PEP] over time. The colour key is blue: generalised kinetics (GK), green: Michaelis-Menten (MM), red: mass action (MA). The response of the model to NADH was omitted as there was a negligible change in steady state.

