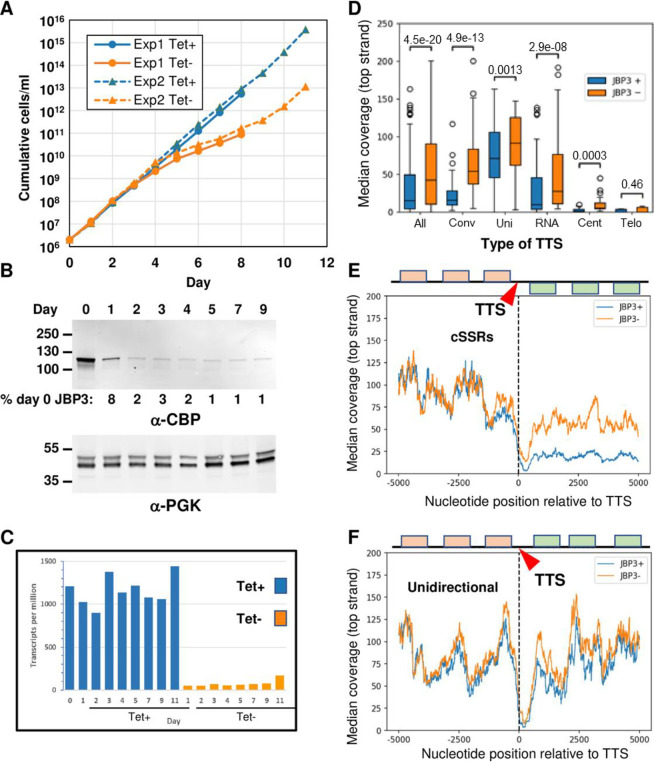
FIG 5.
Depletion of JPB3 results in readthrough at transcription termination sites. (A) Growth analysis. Two independently generated L. tarentolae clones lacking endogenous JBP3 but containing a Tet-regulated TAP-tagged JBP3 gene were grown in the presence or absence of Tet. The numbers on the y axis are corrected for dilution during subculturing. The solid lines show a clone where the JBP3 genes were replaced by pac (and grown in the presence of puromycin), while the dotted lines show a clone where the JBP3 genes were replaced by neo (and grown in G418). Exp1 and Exp2 refer to experiments 1 and 2, respectively. (B) The level of TAP-tagged JBP3 expressed by the T7-TR/JBP3-MHTAP/Δjbp3::neo clone grown in the absence of Tet was monitored by Western blotting using antibodies against the calmodulin-binding peptide (CBP) of the TAP tag. Antibodies against phosphoglycerate kinase (PGK) served as a loading control. The percent JBP3 levels in comparison to day 0 are shown below the anti-CBD blot. (C) JBP3-TAP mRNA levels for the T7-TR/JB3-MHTAP/Δjbp3::neo clone grown in the presence or absence of Tet for the number of days indicated. mRNA levels are expressed as transcripts per million as determined by RNA-seq analysis using Geneious. (D) Box-and-whisker plots showing the median top strand coverage in the 5-kb region downstream of all 192 TTSs (All). Separate plots are shown for the 46 TTSs at cSSRs (Conv), 30 TTSs between head-to-tail PTUs (Uni), 39 TTSs immediately upstream of one or more RNA genes (RNA), 21 TTSs adjacent to a centromere (Cent), and 56 TTSs at telomeres (Telo). (E) Median top strand coverage at each nucleotide position in the 10 kb surrounding the 46 TTSs at cSSRs. The schematic represents the protein-coding genes associated with each strand at an “average” convergent TTS (cTTS). The second PTU at each cSSR is reoriented so that the genes are represented on the top strand. (F) Median top strand coverage at each nucleotide position in the 10 kb surrounding the 30 TTSs between unidirectional (head-to-tail) PTUs. The schematic represents the protein-coding genes associated with each strand at an “average” unidirectional TTS (uTTS).

