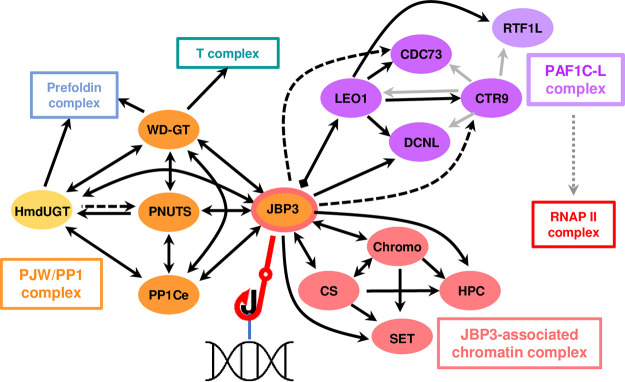
FIG 6.
Network of interactions between JBP3-associated protein complexes. Solid lines denote proteins enriched in both replicates of the TAP-tag pulldowns, and dashed lines indicate proteins enriched in only one sample. Double-headed lines represent reciprocal enrichment with both proteins used as bait, while a diamond shape at one end of the line indicates that JBP3 was not detected in the LEO1 pulldown. Lines with a single arrowhead indicate that reciprocal enrichment was not attempted. Gray arrows represent interactions identified by copurification of proteins with CTR9 in T. brucei (38). Subunits within the three distinct JBP3-associated protein complexes are denoted by different colors, while the chaperone and RNA polymerase complexes are represented by boxes without individual components. The dotted line connecting the PAFC1-L complex to RNAP II reflects the interactions observed in other organisms. The interaction between JBP3 and base J is marked by the red fishhook.

