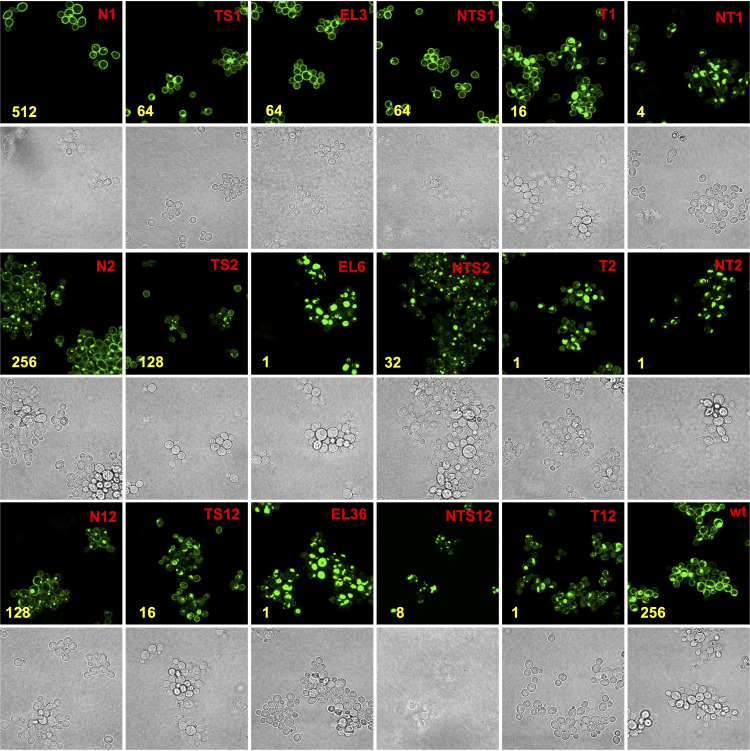
FIG 3.
Confocal microscopy of ADΔΔ cells overexpressing Cdr1PC-GFP variants. ADΔΔ/CaCDR1P-GFP (wt; bottom right) was included as a positive control. Brightfield and fluorescent images of cells expressing the N-terminal variants are at the top, images of cells expressing the C-terminal variants are displayed underneath, and variants of N- and C-terminal subdomain combinations are shown at the bottom; see text for further details. MICFLC values (mg/liter) are indicated in yellow. To allow fair comparisons, all images were taken with identical confocal microscope settings.

