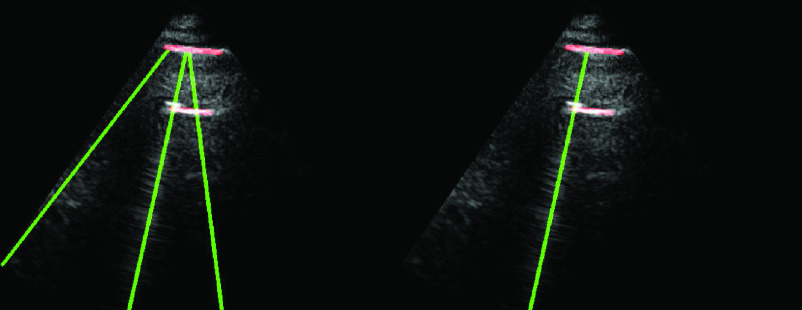
Fig. 5.
Example demonstrating the validation procedure in step 7. Figure on the left refers to the detection result without validation, whilst the right one is with the validation. The
 index values for the detected B-lines from left to right are −0.235, 0.677, and 0.198, respectively. The corresponding validation criterion
 is 0.25 for this example.

