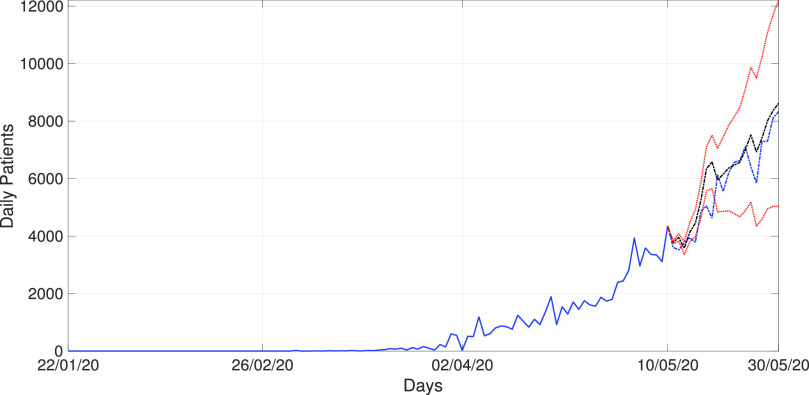
Fig. 5.
Predicted COVID-19 time series for India using the proposed method during May 11, 2020 to May 30, 2020. Note: In Figs. 5–8, the blue solid line shows the training period. The black dashed–dotted line shows the forecast values. The blue dotted line represents the actual data values in the forecast period. The red dotted lines represent the RMSE with 95% confidence interval.

