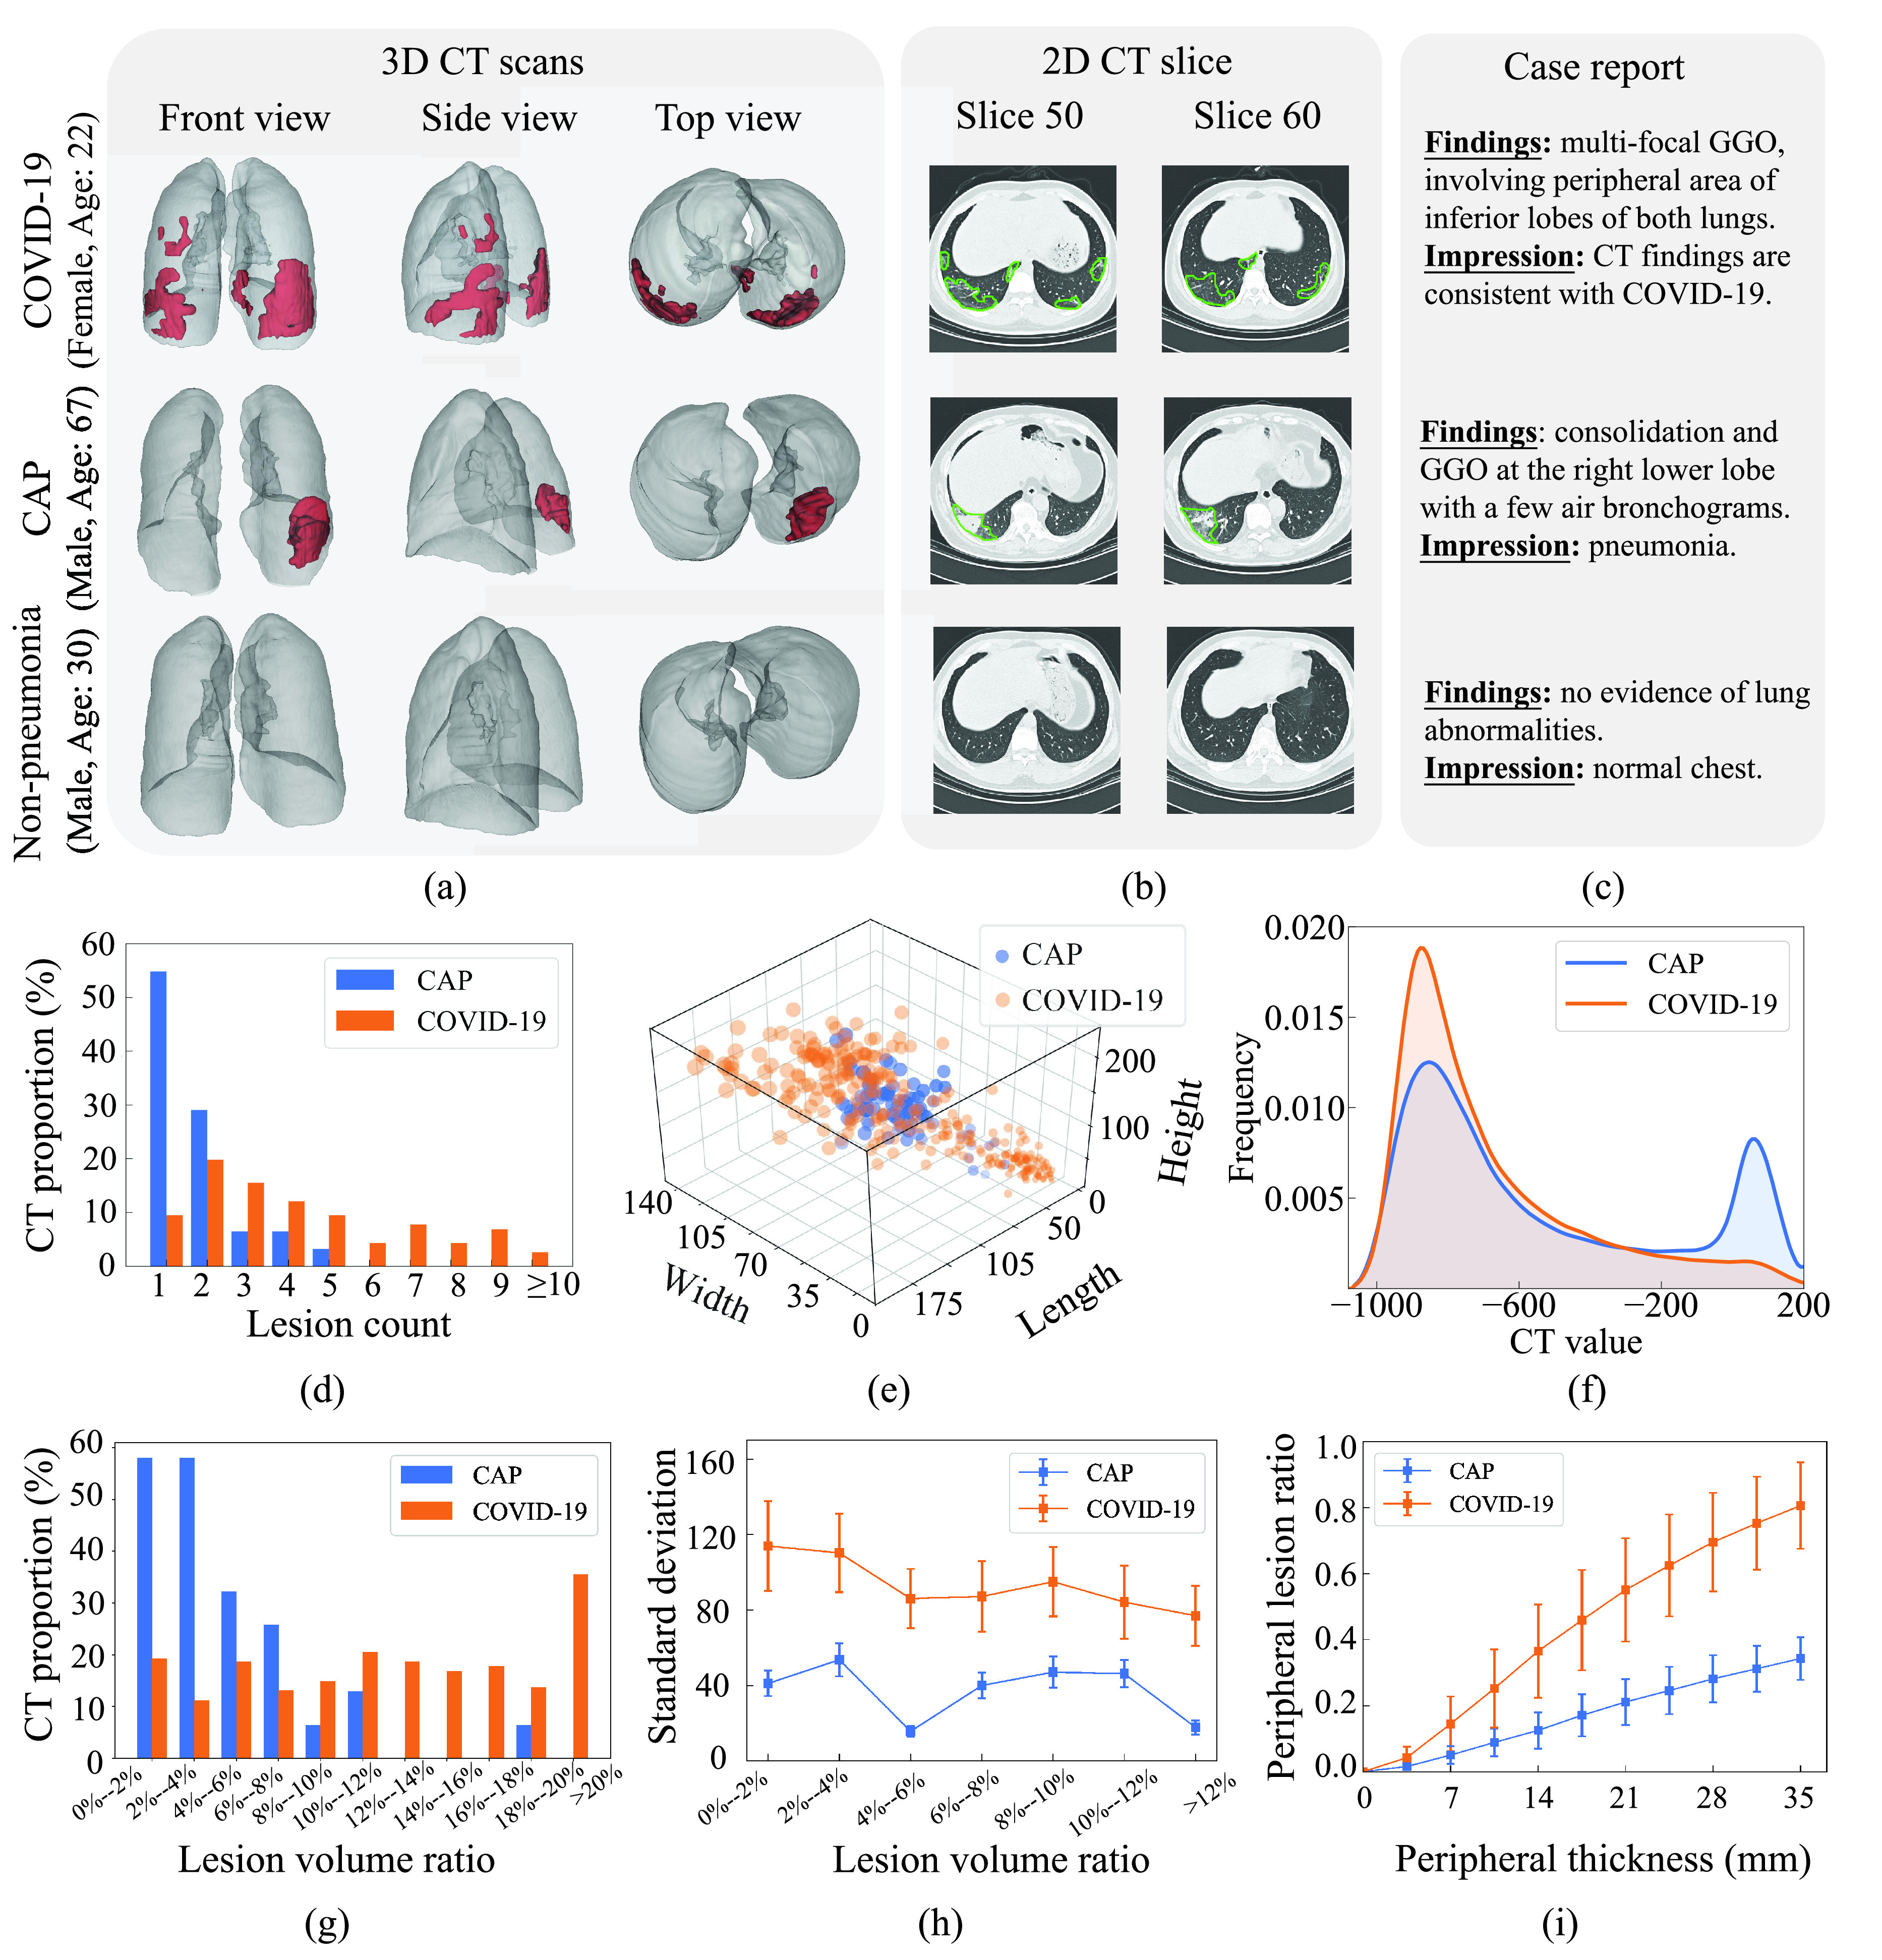
Fig. 1.

Illustration and statistical analysis of our database. (a) Front, side and top views of 3D chest CT scans with 3D lesion segmentation for one COVID-19 (upper row), one CAP (middle row) and one non-pneumonia (lower row) individuals. Note that the lesions in lungs are marked in red. (b), Two selected 2D CT slices, corresponding to 3D CT scan in the same row. The lesions in each slice are encircled by green lines. (c) Case reports of the three individuals. (d) Histogram of lesion counts in the CT scans for all COVID-19 and CAP individuals in our 3DLSC-COVID database. (e) Width, length and height of each lesion in 3D CT scans for COVID-19 and CAP, respectively. For better visualization, only 372 lesions are randomly selected from our database. (f) Distribution curves of CT values in the lesions of CAP and COVID-19 CT scans, respectively. (g) Histograms of lesion count in the CT scans for CAP and COVID-19, respectively. (h) Standard deviations of lesion distribution for CAP and COVID-19 with varied lesion volume ratios. (i) Changes of peripheral lesion ratio with peripheral thickness varying from 0 to 35 mm for CAP and COVID-19, respectively. Note that the results of these charts (d,f-i) are obtained upon all CAP and COVID-19 CT scans in our 3DLSC-COVID database.
