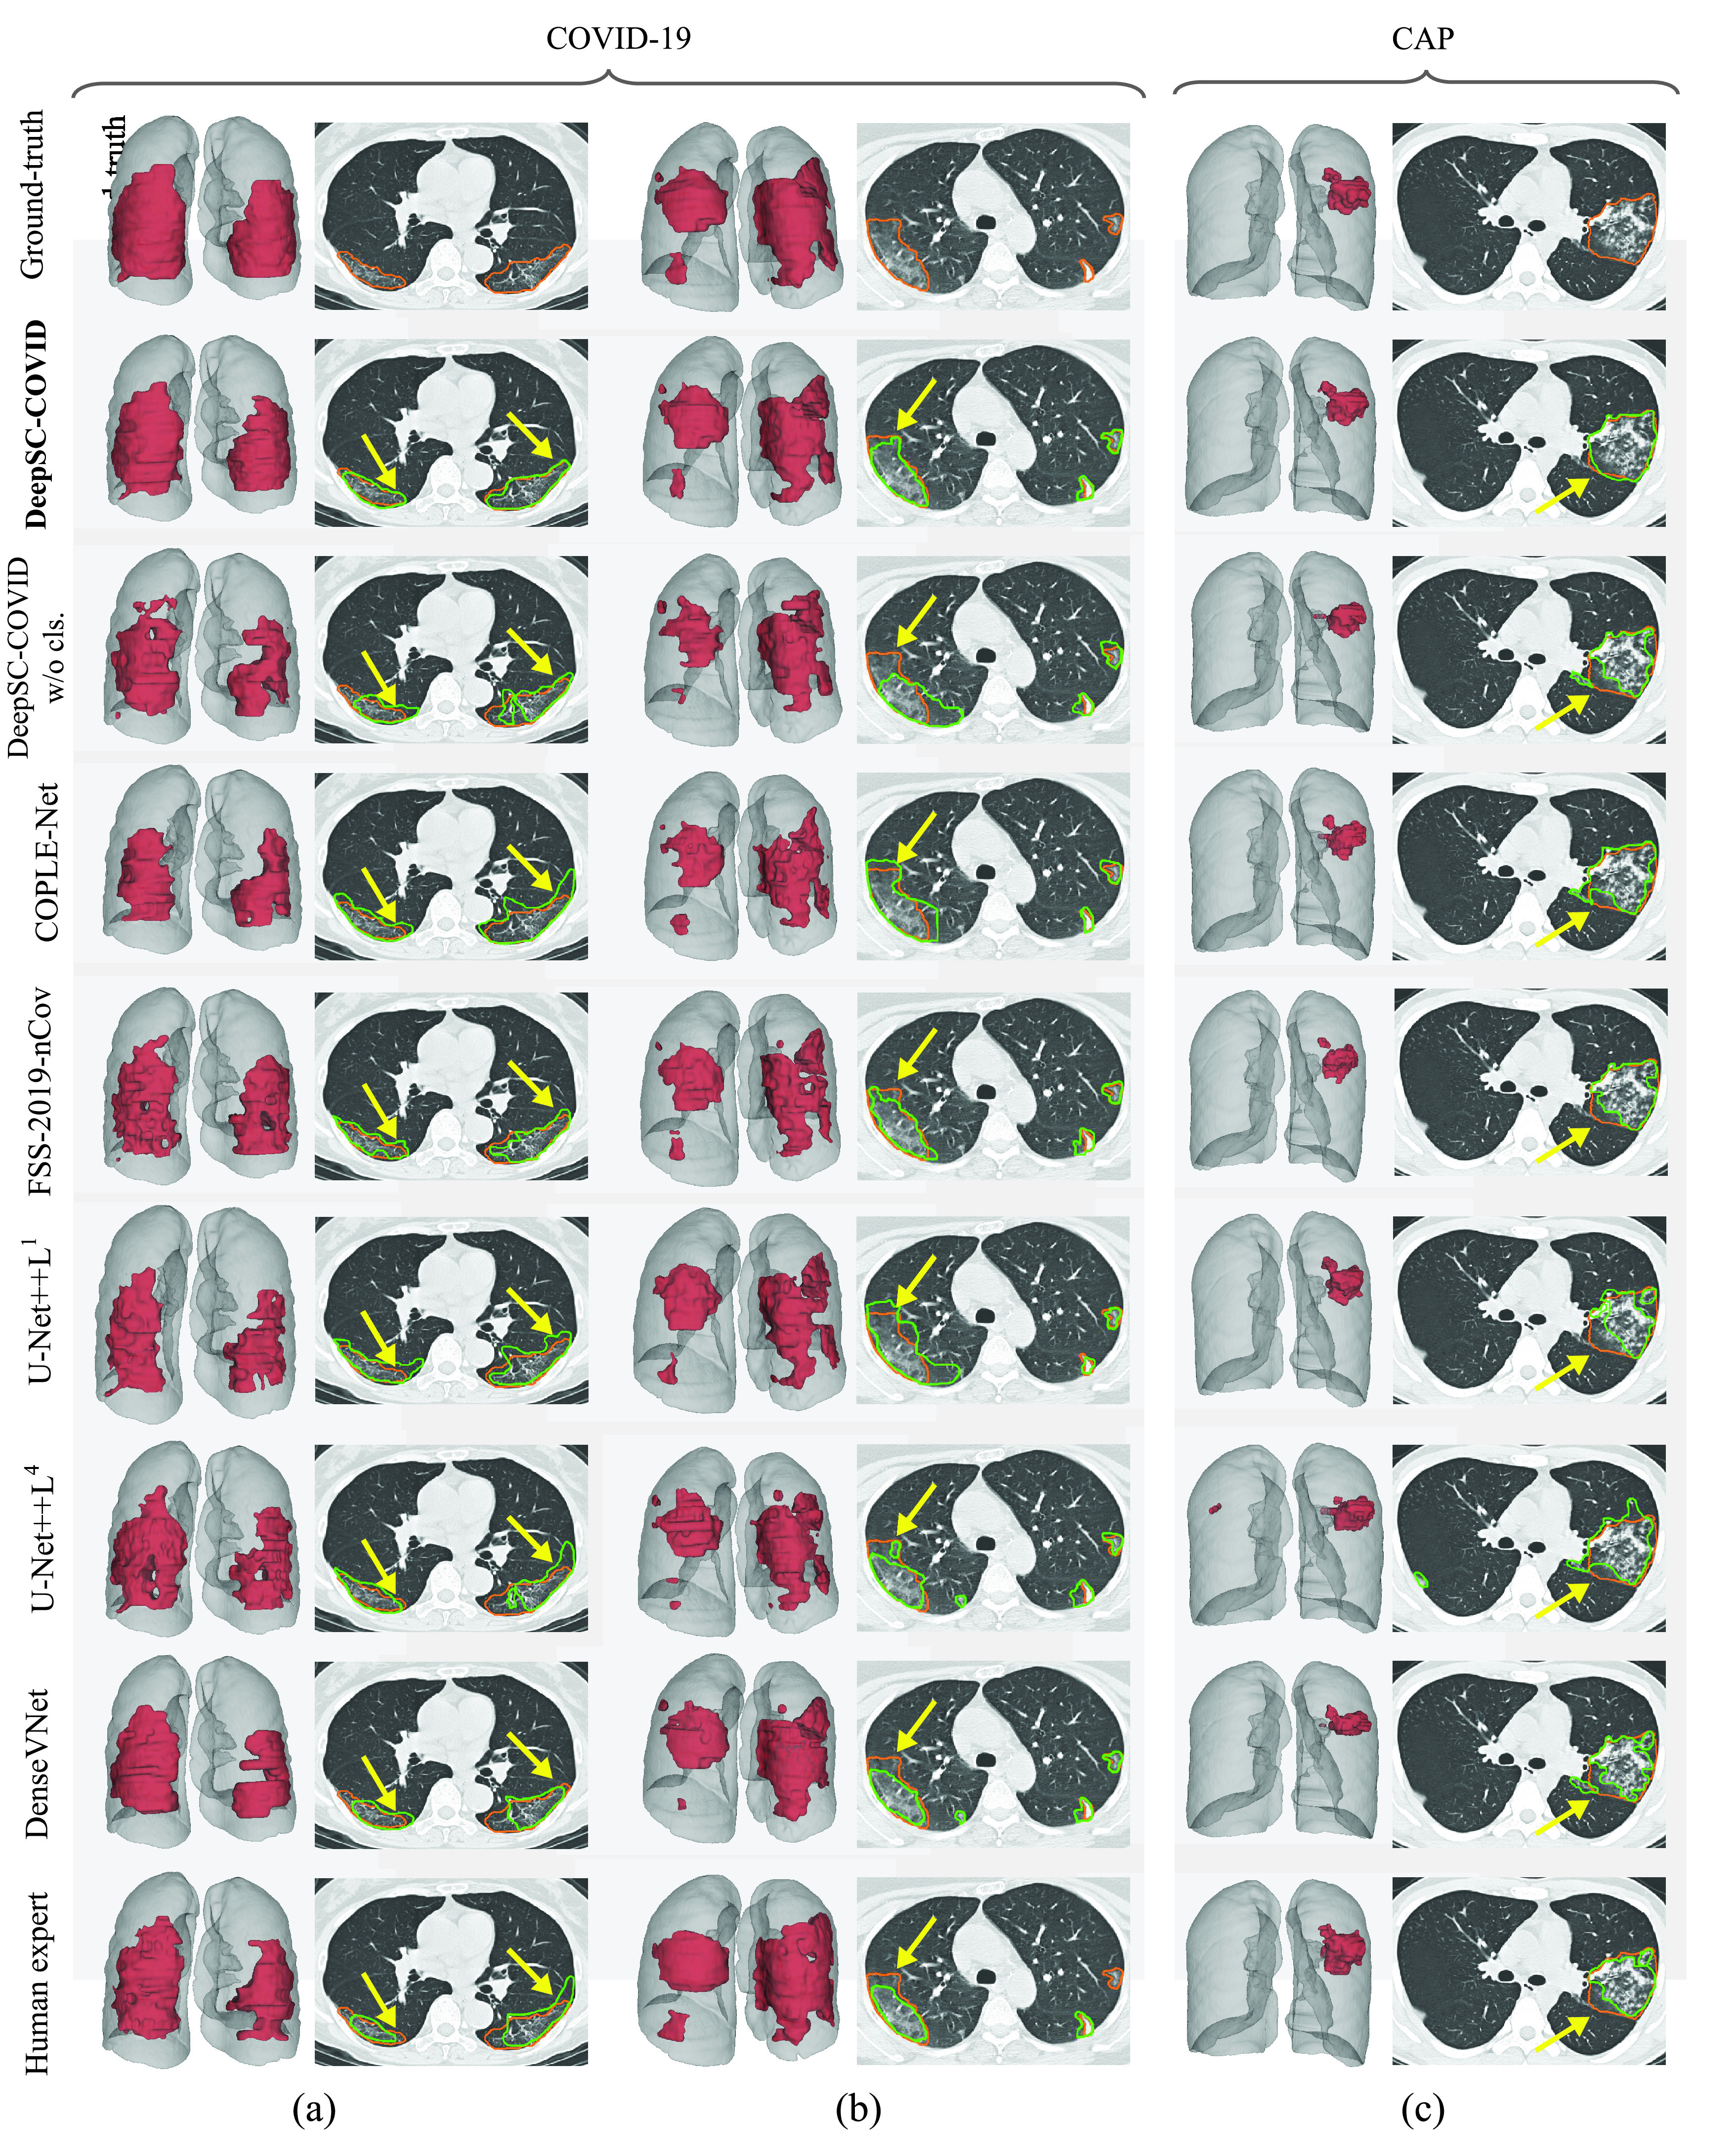
Fig. 6.

Visual comparison of 3D and 2D lesion segmentation results. (a-b) Segmentation results of two COVID-19 samples. (c) Segmentation results of CAP sample. For 3D visualizations, the lesions and lungs are shown in red and grey for better view. For 2D visualizations, orange and green curves indicate the ground-truth segmentation results and the results generated by different methods.
