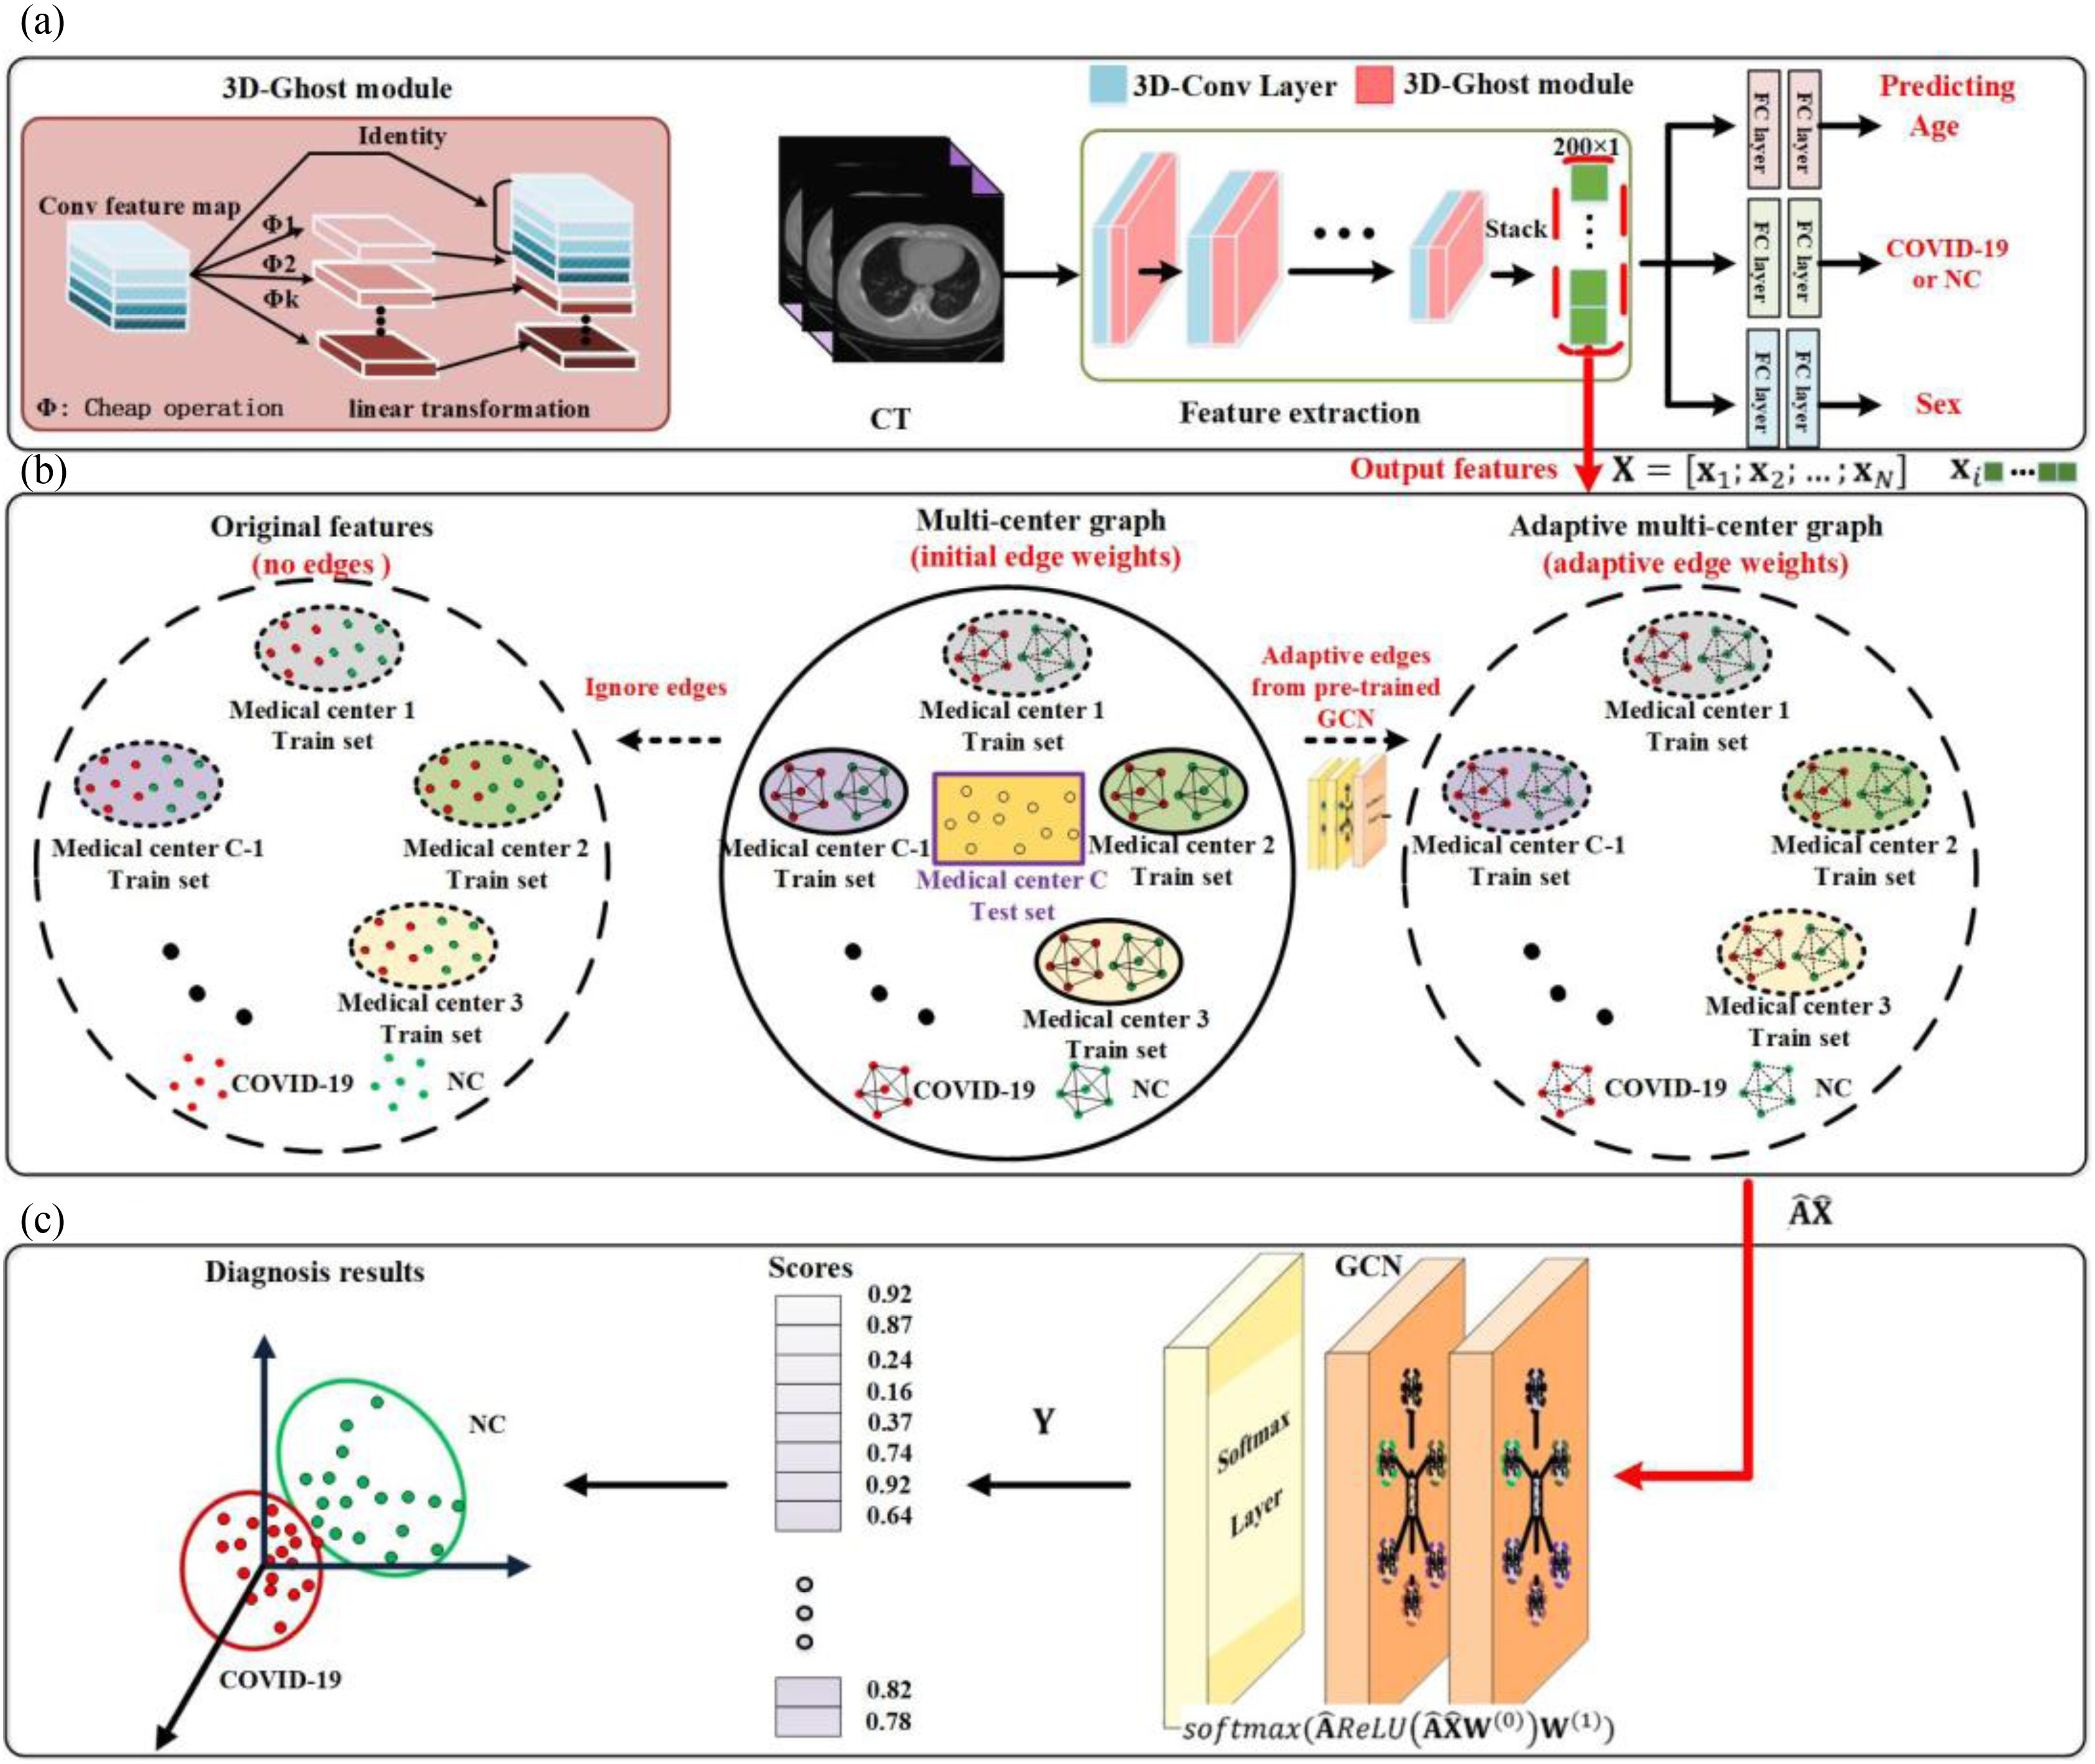
Fig. 2.

Overview of the proposed framework for COVID-19 diagnosis. (a) Several medical centers’ data is used as training sets to train our multitask 3-D-GCNN, and then the trained model is used to extract features for all subjects. (b) We use the extracted features and phenotypic information to construct multicenter graph, then combine it with the original features and adaptive multicenter graph to form the augmented multi-center graph, where only training samples are augmented. (c) We input the augmented multi-center graph into GCN structure. Finally, every subject in test set is assigned a score for final diagnosis. Note that NC means normal case, and a node on the graph means a subject (represented by its features).
