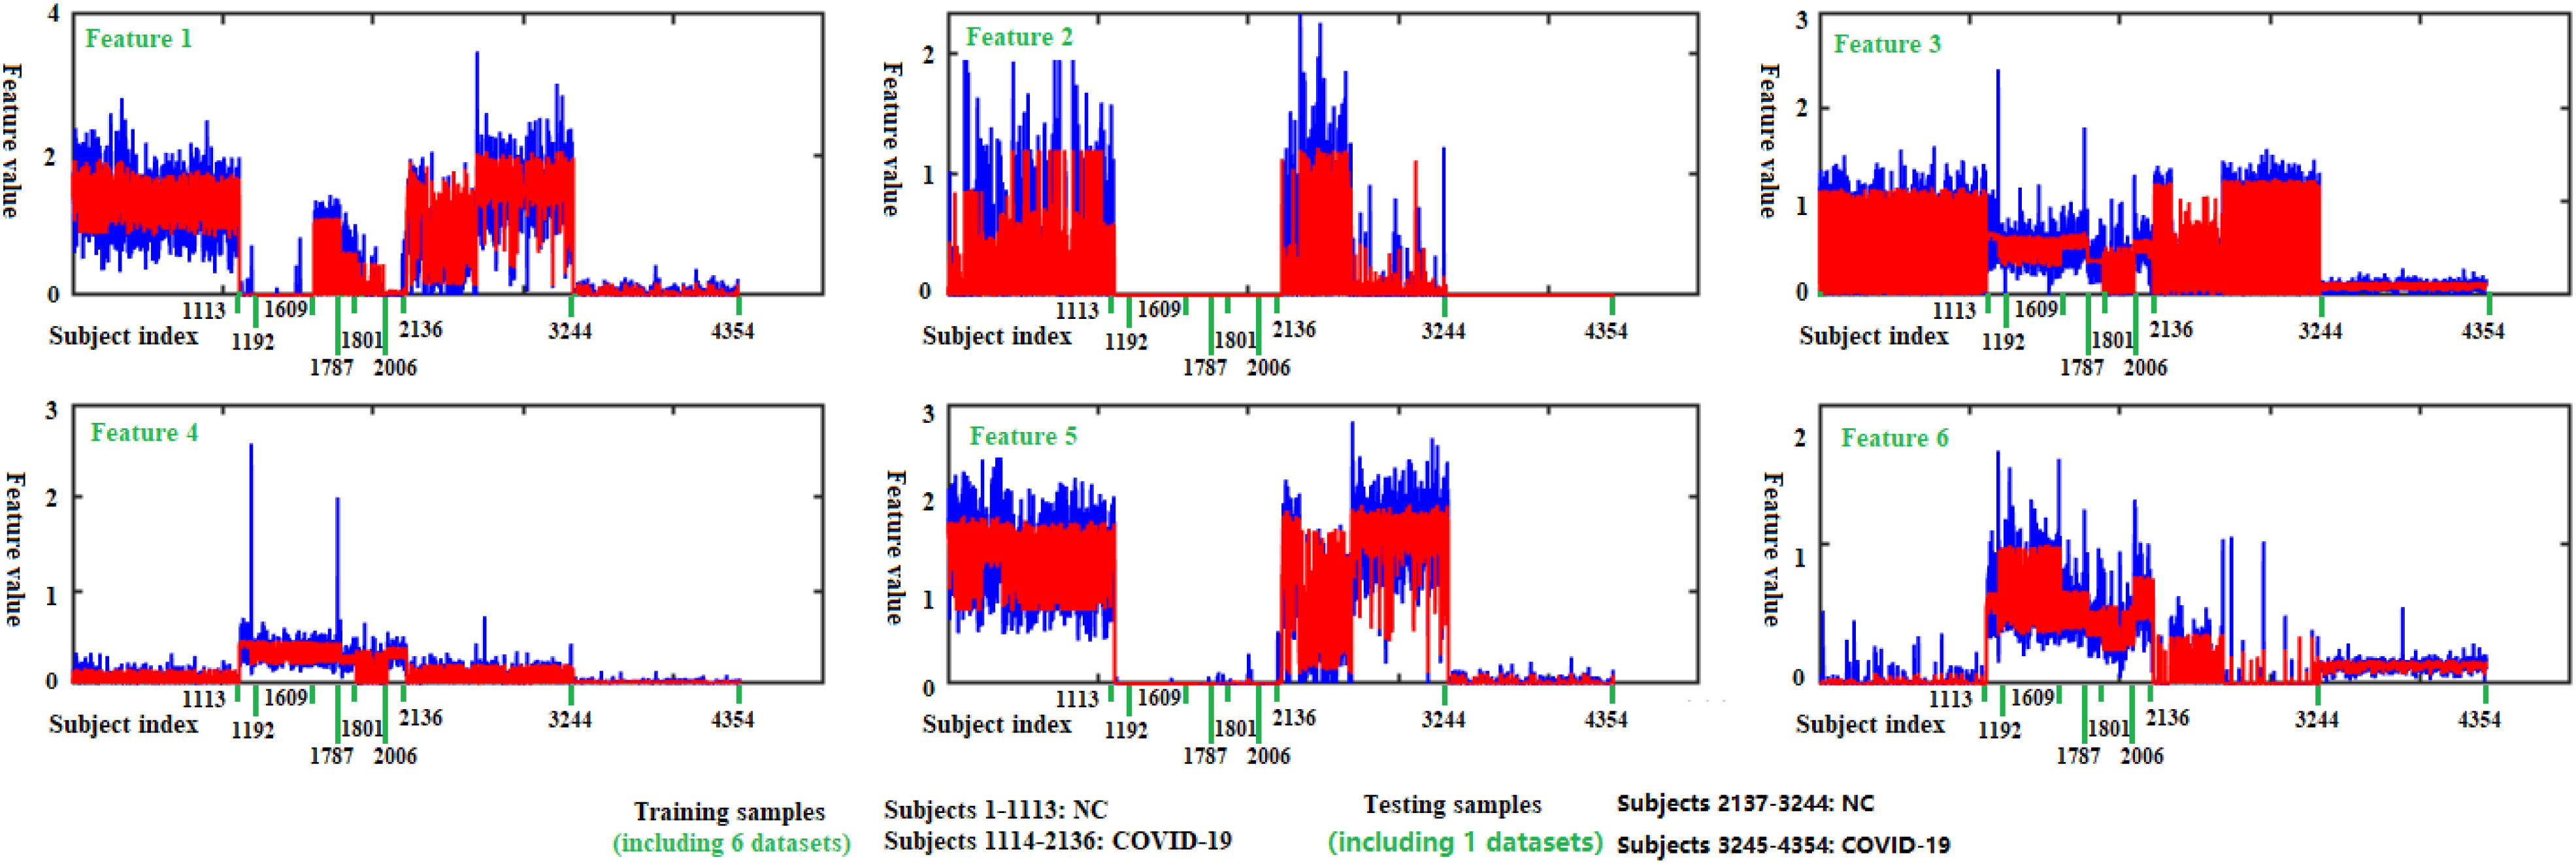
Fig. 5.

Filtering effect of our multicenter graph on the extracted top 6 most discriminative features by comparing  with
with  . Blue lines represent original feature values, and red lines represent filtered feature values.

Filtering effect of our multicenter graph on the extracted top 6 most discriminative features by comparing  with
with  . Blue lines represent original feature values, and red lines represent filtered feature values.