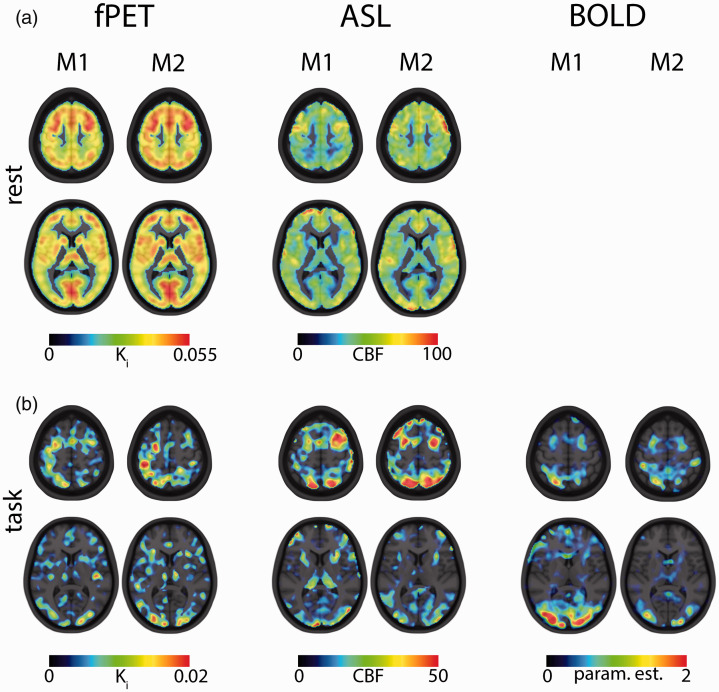
Figure 3.
Visual comparison between measurements 1 and 2 (M1 and M2) for a representative (i.e. average test-retest reliability) subject. (a) At rest, fPET and ASL demonstrate highly similar patterns of Ki and CBF between the two measurements. (b) Task-specific changes in Ki, CBF and BOLD signal show clear activations for the regions of interest frontal eye field (FEF), intraparietal sulcus (IPS) and occipital cortex (OCC) in both measurements. Similar slices as in Figure 2 are presented (z = 8 and z = 56, MNI space).

