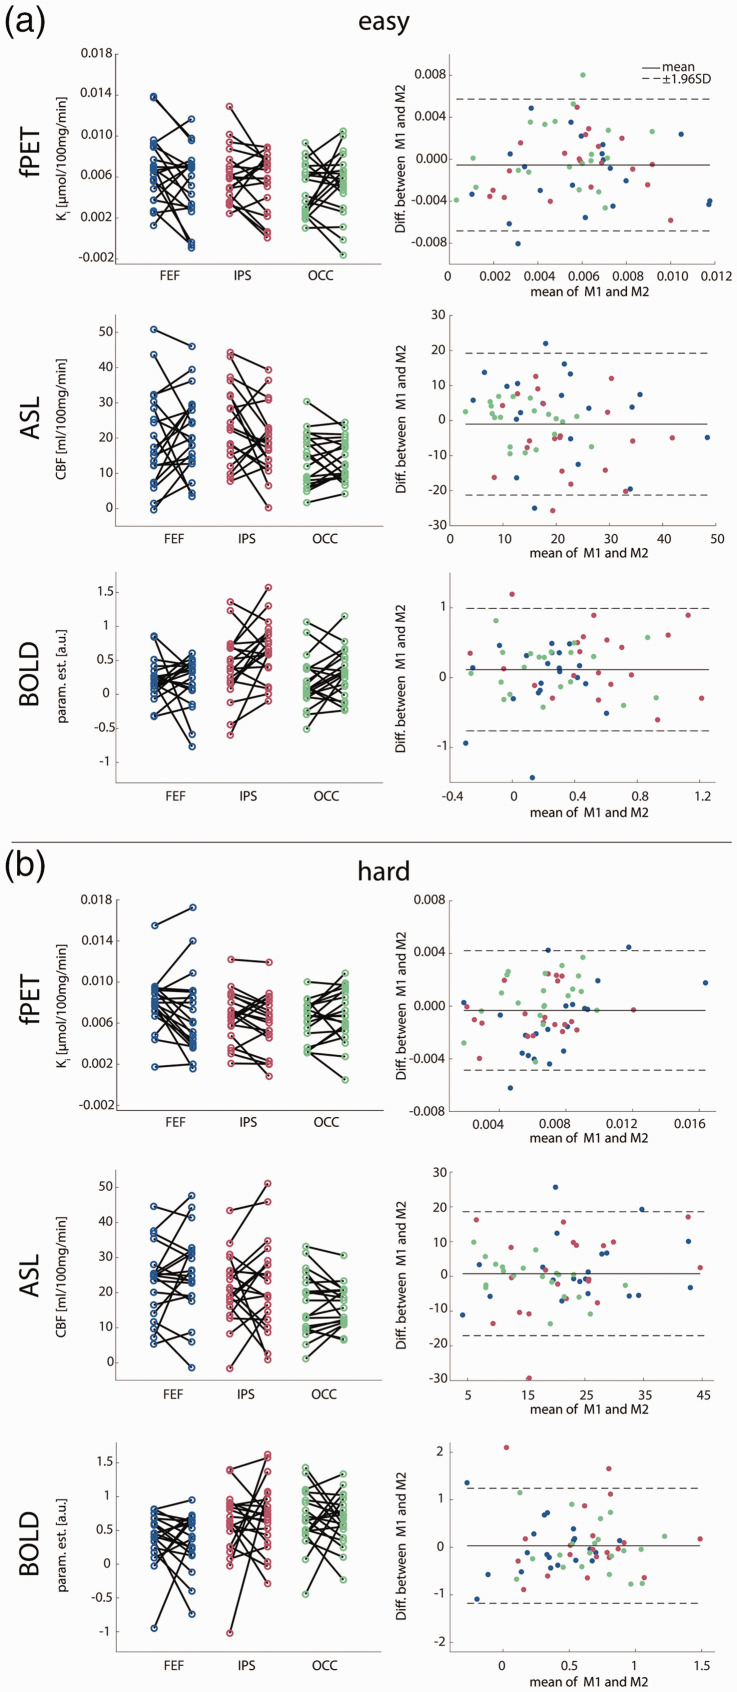
Figure 5.
Task-specific test-retest variability. Scatter and Bland-Altman plots of glucose metabolism (Ki), cerebral blood flow (CBF) and blood oxygen level dependent signal (BOLD, parameter estimates) comparing measurements 1 and 2 (M1 and M2). As for the rest condition, the Bland-Altman plots indicate good agreement without proportional bias or major outliers and comparable limits of agreement between the easy (a) and the hard task (b). No significant differences were observed between the measurements (all p > 0.5 corrected), indicating no relevant systematic bias. See Table 1 for complementary results. Colors for ROIs match those in Figure 2. FEF: frontal eye field, IPS: intraparietal sulcus, OCC: occipital cortex.

