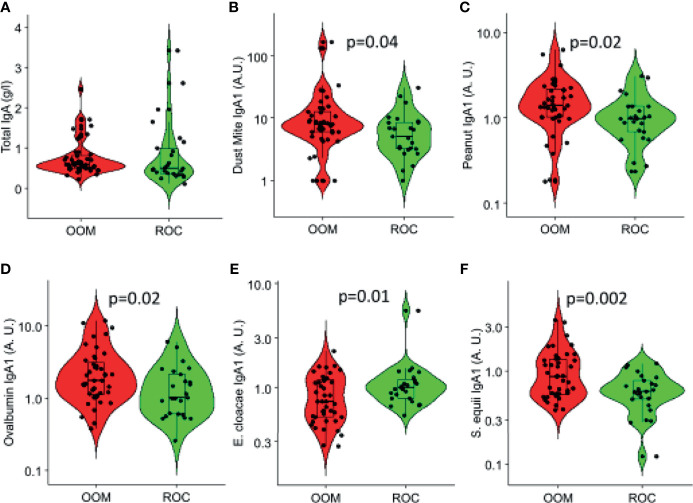
Figure 2.
Total and specific IgA responses in human milk that are significantly different between the OOM (red) and Rochester (green) mothers. (A) Total IgA and IgA specific to (B) dust mite (Der p1 and Der f1), (C) peanut, (D) ovalbumin, (E) E. cloacae, and (F) S. equii are shown. Antigen-specific IgAs are normalized between 0 and 1.

