
Figure 4.
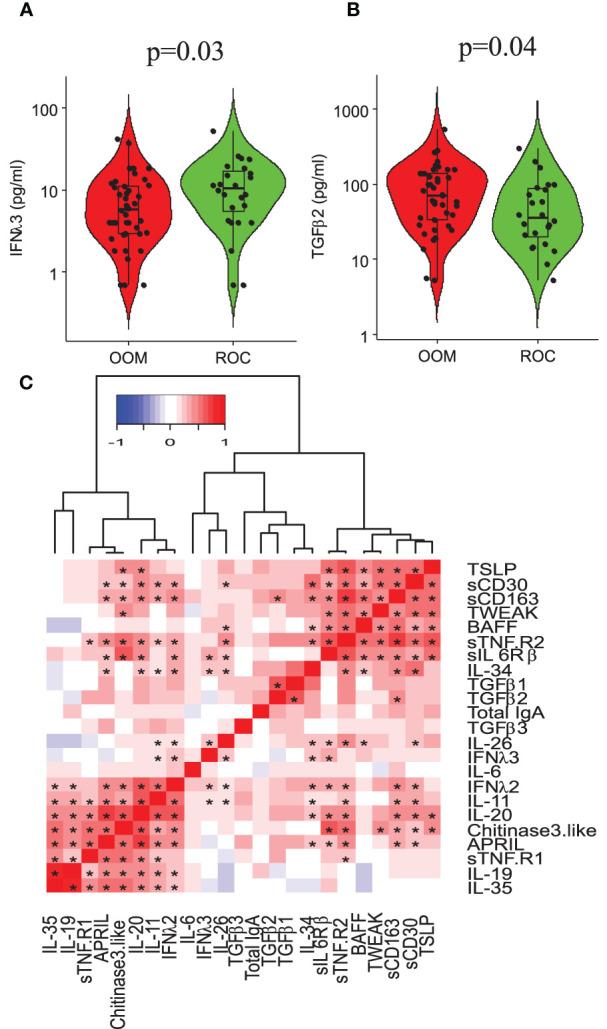
Cytokine profiling of human milk and its association with total IgA levels. Distributions of (A) IL-6 (p = 0.02, 0.05 by Wilcoxon signed-rank test) and (B) TGF-β2 (p = 0.05) in OOM and ROC population shown on logarithmic scale to the base 10. (C) Hierarchial cluster analysis showing correlation between a panel of cytokines. Asterisk, adjusting for mother’s atopy in multivariate analysis.