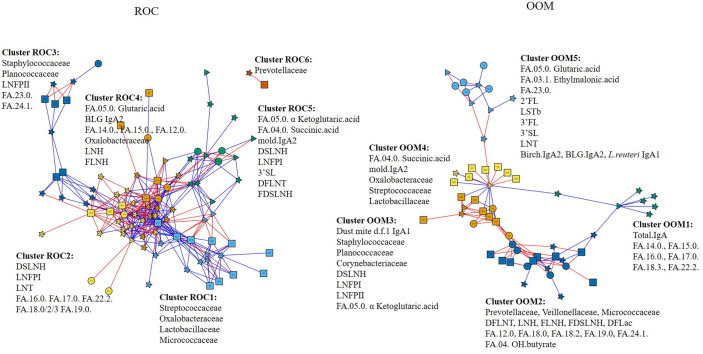
Figure 6.
Integrated communities of human milk components in OOM and Rochester populations. Associations between HMOs, fatty acid metabolites, IgA, specific IgA, and milk microbiome were performed using partial least square regression to identify communities in eight Rochester mother (left) and 12 OOM mother (right) populations. Edges represent R 2 > 0.7 for ROC and 0.6 for OOM. Red and blue edges represent positive and negative correlations, respectively. The shapes of the nodes represent the following components: squares, human milk OTUs; circles, HMOs; triangles, IgA; and stars, fatty acids.

